All I want to do is make the width greater and the height smaller. I'm just doing raster plots but this question applies to any MATLAB figure. I can manually resize it using the figure directly when it's created but I want the program to spit it out in the right size to start with.
Asked
Active
Viewed 2.9e+01k times
92
5 Answers
82
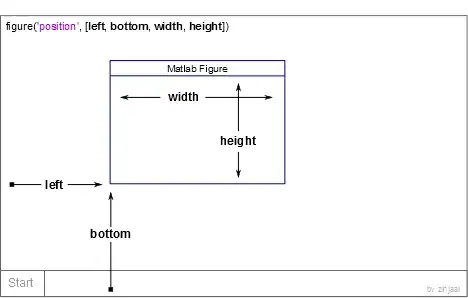
The properties that can be set for a figure is referenced here.
You could then use:
figure_number = 1;
x      = 0;   % Screen position
y      = 0;   % Screen position
width  = 600; % Width of figure
height = 400; % Height of figure (by default in pixels)

figure(figure_number, 'Position', [x y width height]);
Jens C. Thuren Lindahl
- 370
- 2
- 13
Marcus Frödin
- 12,552
- 3
- 25
- 16
-
12And how can you save the figure with the same dimensions defined by `set`? As `saveas(gcf, file, 'png')` uses default dimensions instead. – István Zachar Mar 13 '12 at 12:39
-
@IstvánZachar see https://stackoverflow.com/questions/3600945/printing-a-matlab-plot-in-exact-dimensions-on-paper/3601094#3601094 – Emil Lundberg Mar 27 '15 at 15:18
66
Write it as a one-liner:
figure('position', [0, 0, 200, 500]) % create new figure with specified size
zinjaai
- 2,345
- 1
- 17
- 29
31
 figure (1)
 hFig = figure(1);
 set(gcf,'PaperPositionMode','auto')
 set(hFig, 'Position', [0 0 xwidth ywidth])
 plot(x,y)
 print -depsc2 correlation.eps;       % for saving in eps, look up options for saving as png or other formats you may need
This saves the figure in the dimensions specified
user1934314
- 311
- 3
- 2
-
8+1 for the 'PaperPositionMode' it is necessary of you want to 'print' (export) the figure. – Ali Jan 04 '13 at 12:50
1
I managed to get a good result with the following sequence (run Matlab twice at the beginning):
h = gcf; % Current figure handle
set(h,'Resize','off');
set(h,'PaperPositionMode','manual');
set(h,'PaperPosition',[0 0 9 6]);
set(h,'PaperUnits','centimeters');
set(h,'PaperSize',[9 6]); % IEEE columnwidth = 9cm
set(h,'Position',[0 0 9 6]);
% xpos, ypos must be set
txlabel = text(xpos,ypos,'$$[\mathrm{min}]$$','Interpreter','latex','FontSize',9);

% Dump colored encapsulated PostScript
print('-depsc2','-loose', 'signals');
Thomas
- 11
- 2
0
A different approach.
On the figure() call specify properties or modify the figure handle properties after h = figure().
This creates a full screen figure based on normalized units.
figure('units','normalized','outerposition',[0 0 1 1])
The units property can be adjusted to inches, centimeters, pixels, etc.
See figure documentation.
SecretAgentMan
- 2,856
- 7
- 21
- 41