0

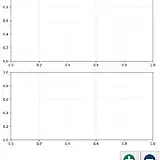
In my code the user should be able to change the amount of subplots in the figure. So first there are two subplots:

enter image description here

I use following code:

ax1 = figure.add_sublots(2,1,1)
ax2 = figure.add_sublots(2,1,2)

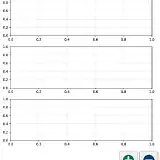
If the plus button is pressed one subplot shall be added:

enter image description here

How should I do this? Is there a command like

ax1.change_subplot(3,1,1)
ax2.change_subplot(3,1,2)
ax3 = figure.add_sublots(3,1,3)

or do I have to delete all subplots and redraw them (which I would like to avoid)?

Jan
  • 171
  • 1
  • 1
  • 8
  • This documentation might help https://matplotlib.org/api/_as_gen/matplotlib.figure.Figure.html#matplotlib.figure.Figure.add_subplot – Roelant Oct 09 '18 at 14:54
  • I know this doc. It's not written there or I don't understand it. One can add plots but not change the position of existing ones. – Jan Oct 09 '18 at 14:58

2 Answers2

1

Here is one option. You can create a new GridSpec for each number of subplots you want to show and set the position of the axes according to that gridspec.

import matplotlib.pyplot as plt
from matplotlib.gridspec import GridSpec
from matplotlib.widgets import Button

class VariableGrid():
    def __init__(self,fig):
        self.fig = fig
        self.axes = []
        self.gs = None
        self.n = 0

    def update(self):
        if self.n > 0:
            for i,ax in zip(range(self.n), self.axes):
                ax.set_position(self.gs[i-1].get_position(self.fig))
                ax.set_visible(True)

            for j in range(len(self.axes),self.n,-1 ):
                print(self.n, j)
                self.axes[j-1].set_visible(False)
        else:
            for ax in self.axes:
                ax.set_visible(False)
        self.fig.canvas.draw_idle()


    def add(self, evt=None):
        self.n += 1
        self.gs= GridSpec(self.n,1)
        if self.n > len(self.axes):
            ax = fig.add_subplot(self.gs[self.n-1])
            self.axes.append(ax)
        self.update()

    def sub(self, evt=None):
        self.n = max(self.n-1,0)
        if self.n > 0:
            self.gs= GridSpec(self.n,1)
        self.update()


fig = plt.figure()

btn_ax1 = fig.add_axes([.8,.02,.05,.05])
btn_ax2 = fig.add_axes([.855,.02,.05,.05])
button_add =Button(btn_ax1, "+")
button_sub =Button(btn_ax2, "-")


grid = VariableGrid(fig)
button_add.on_clicked(grid.add)
button_sub.on_clicked(grid.sub)

plt.show()

enter image description here

ImportanceOfBeingErnest
  • 321,279
  • 53
  • 665
  • 712
0

The command I was looking for is:

ax1.change_geometry(3,1,1)

With this command it is possible to rearrange the sublots. I found this solution here: Dynamically add subplots in matplotlib with more than one column

Jan
  • 171
  • 1
  • 1
  • 8