21

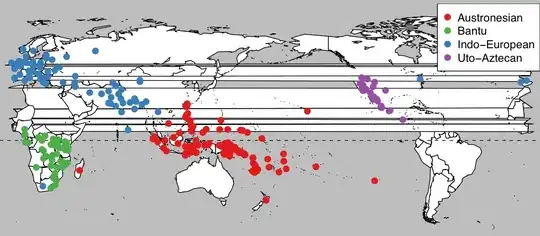
I'm plotting some points on a map of the world using the R maps package, something like:

Map of the world, -180° to 180° longitude

The command to draw the base map is:

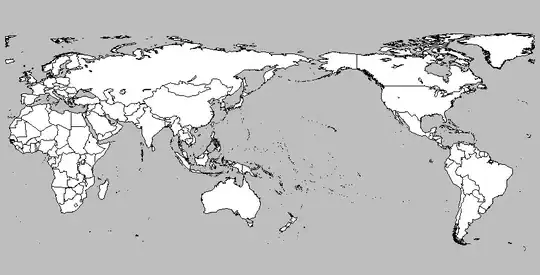
map("world", fill=TRUE, col="white", bg="gray", ylim=c(-60, 90), mar=c(0,0,0,0))

But I need to display Pacific centred map. I use map("world2", etc to use the Pacific centred basemap from the maps package, and convert the coordinates of the data points in my dataframe (df) with:

df$longitude[df$longitude < 0] = df$longitude[df$longitude < 0] + 360

This works if I don't use the fill option, but with fill the polygons which cross 0° cause problems.

Map of the world, 0° to 360° longitude

I guess I need to transform the polygon data from the maps library somehow to sort this out, but I have no idea how to get at this.

My ideal solution would be to draw a maps with a left boundary at -20° and a right boundary at -30° (i.e. 330°). The following gets the correct points and coastlines onto the map, but the crossing-zero problem is the same

df$longitude[df$longitude < -20] = df$longitude[d$longitude < -20] + 360
map("world", fill=TRUE, col="white", bg="gray", mar=c(0,0,0,0),
  ylim=c(-60, 90), xlim=c(-20, 330))
map("world2", add=TRUE, col="white", bg="gray", fill=TRUE, xlim=c(180, 330))

Any help would be greatly appreciated.

Michael Dunn
  • 8,163
  • 4
  • 37
  • 54
  • 1
    Its because the borders don't form closed shapes becuase of where the cut is. – James Mar 18 '11 at 14:51
  • Here is a workaround: Add a large, arbitrary number to df$longitude, say for example 360. This should work, as long as you don't need to show the longitudes on a scale. PS. I have done this successfully using ggplot() graphics. – Andrie Mar 18 '11 at 15:03
  • @James, is a closed polygon just an open polygon with the first point repeated at the end? Do you know how I can manipulate this in the maps package? – Michael Dunn Mar 18 '11 at 15:14
  • @Andrie, df is just a dataframe with the coordinates of my coloured dots: the map polygons are part of the maps library. – Michael Dunn Mar 18 '11 at 15:15
  • Yes, that's correct. You can use the `map_data` function in `ggplot2` to put the data into `data.frame` format, and then check each group to see if it is closed, and add a new data point if not. – James Mar 18 '11 at 15:44
  • 1
    Perhaps worth mentioning here that [`recenter`](https://rdrr.io/cran/sp/man/recenter-methods.html) from `sp` and [`st_shift_longitude`](https://r-spatial.github.io/sf/reference/st_shift_longitude.html) from `sf` packages now do this. – cengel Feb 07 '20 at 17:50

4 Answers4

18

You could use the fact that internally, a map object returned by the map() function can be recalculated and used again in the map() function. I'd create a list with individual polygons, check which ones have very different longitude values, and rearrange those ones. I gave an example of this approach in the function below*, which allows something like :

plot.map("world", center=180, col="white",bg="gray",
   fill=TRUE,ylim=c(-60,90),mar=c(0,0,0,0))

to get

Corrected map center 180

If I were you, I'd shift everything a bit more, like in :

plot.map("world", center=200, col="white",bg="gray",
   fill=TRUE,ylim=c(-60,90),mar=c(0,0,0,0))

Corrected map center 200

The function :

plot.map<- function(database,center,...){
    Obj <- map(database,...,plot=F)
    coord <- cbind(Obj[[1]],Obj[[2]])

    # split up the coordinates
    id <- rle(!is.na(coord[,1]))
    id <- matrix(c(1,cumsum(id$lengths)),ncol=2,byrow=T)
    polygons <- apply(id,1,function(i){coord[i[1]:i[2],]})

    # split up polygons that differ too much
    polygons <- lapply(polygons,function(x){
        x[,1] <- x[,1] + center
        x[,1] <- ifelse(x[,1]>180,x[,1]-360,x[,1])
        if(sum(diff(x[,1])>300,na.rm=T) >0){
          id <- x[,1] < 0
          x <- rbind(x[id,],c(NA,NA),x[!id,])
       }
       x
    })
    # reconstruct the object
    polygons <- do.call(rbind,polygons)
    Obj[[1]] <- polygons[,1]
    Obj[[2]] <- polygons[,2]

    map(Obj,...)
}

*Note that this function only takes positive center values. It's easily adapted to allow for center values in both directions, but I didn't bother anymore as that's trivial.

Joris Meys
  • 106,551
  • 31
  • 221
  • 263
  • 2
    @Michael Dunn : You're welcome. If you ever need the names of the polygons, you'll have to adapt the function so you can double the names of the split polygons in the `$name` element of the map object. – Joris Meys Apr 05 '11 at 08:29
5

install the latest version of maps (3.2.0).

do this:

d$lon2 <- ifelse(d$lon < -25, d$lon + 360, d$lon) # where d is your df
mapWorld <- map_data('world', wrap=c(-25,335), ylim=c(-55,75))

ggplot() +
geom_polygon(data = mapWorld, aes(x=long, y = lat, group = group)) +
geom_point(data = d, aes(x = lon2, y = lat))
petyar
  • 491
  • 3
  • 10
2

A bit late, but you can also create a shifted map by using a projection (requires the mapproj package):

  map("world", projection="rectangular", parameter=0, 
      orientation=c(90,0,180), wrap=TRUE, fill=T, resolution=0,col=0)

This will shift by 180 degrees. But the difference with 'world2' is that the longitude co-ordinate will be different ([-pi,pi]). All projections of this package put 0 at the centre. And in that case, the 'wrap' option detects the jump correctly.

'resolution=0' helps to get cleaner borders.

You can easily change the centre longitude by changing the '180' value in the projection description.

Alex Deckmyn
  • 1,017
  • 6
  • 11
  • 1
    as mentioned in another answer, as of maps 3.2 there is now a simpler way to get the same result without projection: map("world", wrap=c(-90,270), ...). So 'wrap' is not boolean but a vector. Funnily enough, I think it was answering this question originally that set me thinking about implementing that better wrapping code. – Alex Deckmyn Mar 15 '18 at 08:48
0

What about this solution?

xlims = c(0, 359) # these are the limits you want to change
ylims = c(-55,75)

mapWorld <- map_data('world', wrap=xlims, ylim=ylims)
head(mapWorld)

g1 <- ggplot() +
    geom_polygon(data = mapWorld, aes(x=long, y = lat, group = group)) +
    coord_map("rectangular", lat0=0, xlim=xlims, ylim=ylims)

g1
Charly
  • 112
  • 1
  • 6