25

Please note: While the bounty is no longer available, I'm still keen for anyone with an answer to this question to contribute; I'm still watching it, and I'm waiting to see if there is a better answer. Thanks, and please read on...


I am looking for a way to convert an arbitrary set of RCC-like spatial relations (or similar) describing a constraint network into Venn-diagram-like images. For example, the constraint network as expressed in RCC8:

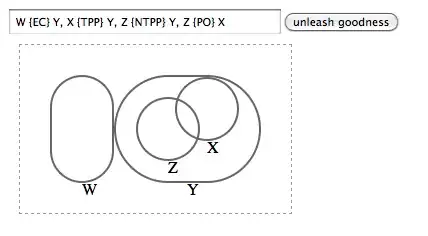
W {EC} Y, X {TPP} Y, Z {NTPP} Y, Z {PO} X.

..could be represented by the following diagram with circular or square regions:
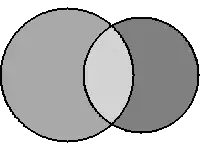
Example 1: Venn diagram representing constraint network using circular regions. ..alternatively:   Venn diagram representing constraint network using square regions.

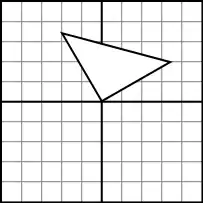
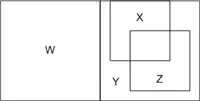
Is anyone aware of software that can at least generate such diagrams programmatically (via an API) from a specification of RCC-like constraints?

I am aware that such a constraint network could be underspecified, precluding a match to any single such diagram (many solutions may exist). Ideally, I would like to deal with this by being able to generate possible alternatives, but can resort to none (and raising an error) for now.

Just to be clear, in this question I am specifically asking for software which can calculate a diagram layout based on RCC-like constraints in a declarative manner. I am not concerned with tools to turn a DSL for RCC into some other syntax, nor am I interested in particular image serialization formats or methods. I am hoping to find an algorithm to do this for dealing with an arbitrary number of constraints for up to six unique sets.

Notes: Graphviz (as @vickirk mentioned below) is an example of a diagram layout software package, which is akin to what I'm after. Unfortunately, it seems that Graphviz itself cannot help with this problem (but I'd be very happy to be proven wrong!). It seems this is a very hard problem.

  • is the number of set pre-defined ? I see there are three number of sets. – S L Mar 24 '11 at 06:19
  • No, the number of sets is not predefined. However, I will generally (n.b., not always) expect anywhere between two to six named sets in the application I'm considering - as a rough estimate. I completely expect that generating an image from a large number (say, >10) of inter-related sets could produce nasty diagrams. –  Mar 24 '11 at 06:29

3 Answers3

19

Who need's a backend? Here's a working prototype using HTML/CSS/JS:

http://jsfiddle.net/RuvE6/6/

Just enter the RCC8 code syntax in the field and hit the button!

HTML/CSS/JS RCC8 Diagram Builder

Some current limitations:

  • Doesn't handle ambiguity
  • There's no error handling if syntax is off
  • Probably breaks in some valid cases (I haven't tested very much)
  • Didn't implement any inverse cases (yet?)

Edit: How it works

Basically, there are two families of relationships shown with these diagrams:

  • A contains B
  • A is adjacent to B.

There are then sub-types or variations, like:

  • A contains B and B is tangential to A
  • A is adjacent to B and A overlaps with to B

Both of the basic concepts are kind of baked into the HTML rendering world:

  • containment --> nested HTML elements: <div class="region"><div class="region"></div></div>
  • adjacency --> sibling HTML elements: <div class="region"></div><div class="region"></div>

I handle the variations with special classes that (rather crudely) wiggle margins around to accomplish the desired layout:

  • containment, with tangent: <div class="region"><div class="region touches-parent"></div></div> (child has negative top margin to touch parent)
  • adjacency, with overlap: <div class="ven"><div class="region"></div><div class="region touches-parent"></div></div> (a wrapper is added to trigger CSS on the children - the second element has negative left margin to overlap the first.)

There is some static markup commented out in the jsfiddle showing the structure I started with.

To complete the functional loop, there is a bit of code that parses the RCC8 statement into A {XX} B parts, and attempts to render the necessary markup for each part. It checks as it goes to not duplicate regions. I also go through afterwards and set the heights of all sibling the same, which ensures they will overlap and/or abut properly.

This code is really just a start, and it has it's conceits. It's basically a linear diagram, which means it doesn't, for instance, handle cases where there are complicated adjacencies, like this:

A {EC} B, C {EC} B, D {EC} B

These might be handled be smarted JS parsing and more complicated CSS, but probably quickly venture into the realm of more force-directed layouts (a smarter bubble chart, for instance).

peteorpeter
  • 4,037
  • 2
  • 29
  • 47
  • impressive! could you explain a little how it works? Also, I've tested on Firefox 3.6.10, and it doesn't work; however it's working on Chrome 8.0 – MarcoS Mar 30 '11 at 06:41
  • +1 Clever stuff! Thanks very much for your suggestion -- some nice diagrams there. I do have doubts about how well the technique could generalize, however -- but nevertheless, it's a good start and it's also the best answer I've had so far. Cheers. –  Mar 30 '11 at 10:42
  • As you mention, some cases don't work: Z {PO} X, Y {PO} X; but if you use Z {PO} X, X {PO} Y it draws it right. You might try an initial topological sort of connected components. – Justin Mar 30 '11 at 19:25
  • @Justin Good idea, and wouldn't be too tricky to code... It gets even more interesting, though, when `X` has 3 or more neighbors - then the layout needs to get radial (or at least involve the y-axis more). That might be when we say we've maxed out HTML's natural layout abilities. To really solve this generically, you probably need a heavily customized force-directed layout of some kind (http://vis.stanford.edu/protovis/ex/force.html + http://vis.stanford.edu/protovis/ex/pack.html?) – peteorpeter Mar 31 '11 at 01:00
  • @peterorpeter: yes, just using PO as the only relation you have to be able to illustrate the general inclusion/exclusion principal. I don't know if this is possible with circles, I keep thinking of curvy sausage shaped regions. – Justin Mar 31 '11 at 14:55
2

I don't know of any software that can generate such diagrams. However, If I had to tackle your problem I would probably explore the possibility of using Scalable Vector Graphics (SVG). I think you can translate your DSL for RCC into SVG XML, and then you can render it (maybe in a Web browser). You can easily find examples on the Web by searching for "svg venn diagram". A nice one is here: here's a diagram that I generate from that website

enter image description here

and here's the corresponding SVG code (also from the website):

<?xml version="1.0" encoding="UTF-8" standalone="yes"?>
<!DOCTYPE svg PUBLIC "-//W3C//DTD SVG 1.0//EN" "http://www.w3.org/TR/2001/REC-SVG-20010904/DTD/svg10.dtd">
<svg 
    height="150" 
    width="200" 
    xmlns="http://www.w3.org/2000/svg" 
    xmlns:svg="http://www.w3.org/2000/svg" 
    xmlns:xlink="http://www.w3.org/1999/xlink">    
<title >WIBR Venn diagram</title>
    <ellipse 
        cx="141.795128105731" 
        cy="75" 
        id="circle2" 
        rx="58.2048718942687" 
        ry="58.2048718942687" 
        style="fill: gray; fill-opacity: 0.5; stroke: black; stroke-width: 1; stroke-opacity: 1" />
    <ellipse 
        cx="67.2091969126074" 
        cy="75" id="circle1" 
        rx="67.2091969126074" ry="67.2091969126074" 
        style="fill: darkgray; fill-opacity: 0.5; stroke: black; stroke-width: 1; stroke-opacity: 1"/>
</svg>

There's also an Apache toolkit for SVG called Batik, which should support display, generation or manipulation of SVGs.

Another option is to use TikZ & PGF with LaTeX: there you have powerful macros that let you programmatically place shapes, and the rendering is done by LaTeX. Here's an example:

\documentclass[a4paper,10pt]{article}

\usepackage{tikz}
\usetikzlibrary{shapes,calc}

\begin{document}

\pagestyle{empty}

\begin{tikzpicture}

    \node (TPP) {X TPP Y};

    \node
        [ circle,
            draw,
            minimum width=2cm,
            label={[label distance=-0.7cm]145:X},
        ] (X) [right of=TPP,xshift=1cm] {};

    \node
        [ circle,
            draw,
            minimum width=1cm,
            anchor=south east,
        ] (Y) at (X.south east) {Y}; 

\end{tikzpicture}

\end{document}

which produces the following (i.e. the RCC8 TPP relation):

enter image description here

You can see from the LaTeX code that you can draw the Y circle at south west of X (X.south west) saying that Y's anchor is also at south west (anchor=south west). You can find a more complex example here, and some additional discussion here.

Although this is not yet a layout algorithm that draws RCC8 relation for you, I think you can define LaTeX macro that translate RCC8 relations into PGF/TikZ macros. The drawback is that you must then compile the LaTeX code.

I hope this helps and good luck!

Community
  • 1
  • 1
MarcoS
  • 13,386
  • 7
  • 42
  • 63
  • Thanks for your suggestion, and I had indeed considered SVG (and somewhat surprisingly, am very familiar with Batik) as a serialization syntax for the images, but this doesn't answer my original question. I'm still stuck with the problem of converting an RCC specification into a diagram; a solution for which will include a sophisticated **layout** algorithm which can generate the image specification in whatever serialization format. –  Mar 24 '11 at 12:12
  • I don't know of any layout algorithm that can help you. In the past I've used [yEd](http://www.yworks.com/en/products_yed_about.html) which has powerful layout algorithms (and also java APIs), but I'm afraid it doesn't do what you want. I edited my answer with an additional idea (using PGF & TikZ with LaTeX), which give you a way to programmatically describe your diagram, and let LaTeX render it. It's still not exactly what you want, but I found it very powerful in the past. Good luck! – MarcoS Mar 24 '11 at 15:36
  • 1
    I created some quite a while back using latex + graphviz (or at least I'm pretty sure thats what I used). I can't remember exactly and I've long lost teh documents but it took a lot of playing about with subgraphs and clusters to get it going. The latex was supplemental, graphviz did the layout – vickirk Mar 25 '11 at 13:39
  • @vickirk: yes, [graphviz](http://www.graphviz.org/) is good at doing layout of (directed) graph; same functionality as [yEd](http://www.yworks.com/en/products_yed_about.html) that I've mentioned in a previous comment. – MarcoS Mar 25 '11 at 14:55
  • @vickirk thanks for mentioning Graphviz (I should have brought that up in the original post! Edited now.) I'm after something like Graphviz which can compute the diagram layout for me. –  Mar 26 '11 at 01:34
  • @MarcoS Thanks for mentioning yEd - what a great tool! – peteorpeter Mar 30 '11 at 21:52
0

Have you evaluated antlr, You could define an EBNF grammar for RCC8. Use antlr to generate an item list. This item list can be used as an input to software like VennMaster for drawing diagrams.

Other options are Goolge Charts ,

http://bioinfogp.cnb.csic.es/tools/venny/index.html

kiran.kumar M
  • 811
  • 8
  • 25
  • Thanks for your suggestions. However, the products you mention (Google Charts, Venny and VennMaster) do **not** support the kind of constrained drawing capability I need which corresponds to a range of RCC(8)-like relations (they only seem to support a strict subset of these describing intersections). –  Mar 24 '11 at 05:55
  • I am also familiar with ANTLR, amongst other things that could be used to get me from one syntax (like my own DSL for RCC or some logic) to another as input to the right software... but the real question is: **does software exist that can generate such diagrams from a language with an expressivity like RCC?** –  Mar 24 '11 at 06:00