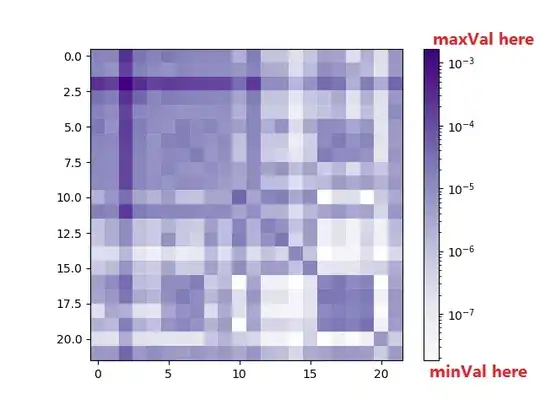
I would like to add top and bottom values to my color bar. So the range the top value is the max number of the values in my data, and bottom is the min number of my data
import numpy as np
import matplotlib.pyplot as plt
import matplotlib

data = np.genfromtxt("E:\\data\\data1.txt", delimiter="\t")
minVal =  np.min(data[np.nonzero(data)])
maxVal =  np.max(data[np.nonzero(data)])

fig, ax = plt.subplots()
im = ax.imshow(data, cmap='Purples',
           interpolation='nearest',
           norm=matplotlib.colors.LogNorm(),
           vmin=minVal,vmax = maxVal,
               )

cbar = fig.colorbar(im)

print("min ",minVal)
print("max", maxVal)

plt.show()

