2

I have a Spark SQL that used to execute < 10 mins now running at 3 hours after a cluster migration and need to deep dive on what it's actually doing. I'm new to spark and please don't mind if I'm asking something unrelated.

Increased spark.executor.memory but no luck.

Env: Azure HDInsight Spark 2.4 on Azure Storage

SQL: Read and Join some data and finally write result to a Hive metastore.

The spark.sql script ends with below code: .write.mode("overwrite").saveAsTable("default.mikemiketable")

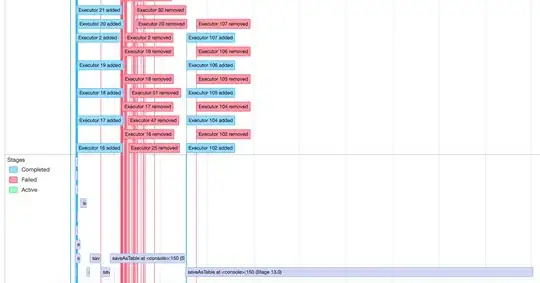
Application Behavior: Within the first 15 mins, it loads and complete most tasks (199/200); left only 1 executor process alive and continually to shuffle read / write data. Because now it only leave 1 executor, we need to wait 3 hours until this application finish. enter image description here

Left only 1 executor alive enter image description here

Not sure what's the executor doing: enter image description here

From time to time, we can tell the shuffle read increased: enter image description here
Therefore I increased the spark.executor.memory to 20g, but nothing changed. From Ambari and YARN I can tell the cluster has many resources left. enter image description here
Release of almost all executor enter image description here

Any guidance is greatly appreciated.

Igor Dvorzhak
  • 4,360
  • 3
  • 17
  • 31
OysterSing
  • 165
  • 1
  • 1
  • 12
  • What changed after migration? Spark version? – Igor Dvorzhak Mar 24 '19 at 15:15
  • Hi @Magnus did you find some time to try increasing the partition number? – abiratsis Mar 25 '19 at 12:09
  • I checked my joining tables is a 9 GB table A left outer join 10MB table B left outer join 5MB table C left outer join 1MB table D 1MB table E left outer join with table C And I have 20GB of spark.executor.memory as well and that's it. Today I re-examed everything that if I 9 GB table A left outer join 10MB table B left outer join 5MB table C (pre-left outer join with table E) left outer join 1MB table D – OysterSing Mar 25 '19 at 12:35
  • Hi @MagnusTheStrong since you have joins, try to repartition() based on the keys used on the joins! If you use more than one key in your join use that combination. As I mentioned below, the problem in your case is caused because of the large shuffling (as reflected on Spark UI). If you want to avoid shuffling you should ensure the co-existence of the keys through repartition i.e repartition(1024, "col1", "col2", "col3"). Good luck – abiratsis Mar 26 '19 at 08:27

1 Answers1

0

I would like to start with some observations for your case:

  1. From the tasks list you can see that that Shuffle Spill (Disk) and Shuffle Spill (Memory) have both very high values. The max block size for each partition during the exchange of data should not exceed 2GB therefore you should be aware to keep the size of shuffled data as low as possible. As rule of thumb you need to remember that the size of each partition should be ~200-500MB. For instance if the total data is 100GB you need at least 250-500 partitions to keep the partition size within the mentioned limits.
  2. The co-existence of two previous it also means that the executor memory was not sufficient and Spark was forced to spill data to the disk.
  3. The duration of the tasks is too high. A normal task should lasts between 50-200ms.
  4. Too many killed executors is another sign which shows that you are facing OOM problems.
  5. Locality is RACK_LOCAL which is considered one of the lowest values you can achieve within a cluster. Briefly, that means that the task is being executed in a different node than the data is stored.

As solution I would try the next few things:

  • Increase the number of partitions by using repartition() or via Spark settings with spark.sql.shuffle.partitions to a number that meets the requirements above i.e 1000 or more.
  • Change the way you store the data and introduce partitioned data i.e day/month/year using partitionBy
abiratsis
  • 7,051
  • 3
  • 28
  • 46
  • Hi Alexandros, I did try below action but nothing changed: .partitionBy("a date selected") in write.table statement -> nothing changed .repartition(1000) in write.table statement -> nothing changed sqlContext.setConf("spark.sql.shuffle.partitions", "1000") -> spin more tasks but nothing changed in speed – OysterSing Mar 25 '19 at 12:19
  • I do find out that in this new cluster, spark.sql.join.preferSortMergeJoin => false spark.sql.autoBroadcastJoinThreshold => -1 – OysterSing Mar 25 '19 at 12:21
  • Hello @MagnusTheStrong spark.sql.autoBroadcastJoinThreshold => -1 means that broadcasting is disabled by default for joins although I cant really say if it would be helpful if I dont see the code. Could you please be more specific when you say you applied the re-partition already? What did you try and how? It would be very useful if you could post some code. I am saying that because if the repartition occurs in a late stage then you have no benefit from it. So usually you must use repartition in a early stage to avoid the shuffling of data! – abiratsis Mar 25 '19 at 12:37
  • Also, by early I mean before join for example :) – abiratsis Mar 25 '19 at 12:48
  • Hello @MagnusTheStrong did you find a solution? – abiratsis Mar 30 '19 at 16:01
  • Hey Alexandro, thanks so much for the help. I tried your suggestion but nothing improved - however, I'm looking at a new perspective - 19/04/01 08:07:08 INFO InternalParquetRecordWriter: mem size 134395806 > 134217728: flushing 771932 records to disk. 19/04/01 08:07:08 INFO InternalParquetRecordWriter: Flushing mem columnStore to file. allocated memory: 127269732 I googled https://issues.apache.org/jira/browse/SPARK-7148, not sure if that is related to parquet.block.size (I don't know how to set it nor check it) and also viewed that spark.maxRemoteBlockSizeFetchToMem = 1880000 – OysterSing Apr 01 '19 at 09:57
  • Hello @MagnusTheStrong you welcome. The max..SizeFetch will affect the default shuffling functionality of Spark and is more likely not related to the issue that you are facing and is a an advanced setting. The behavior that you got is very common in Spark. To make sure that the changes that I suggested were correctly applied please ensure: 1) check how many partitions you have at the moment. You need to make sure that repartition was applied correctly. You can get the partition number with df.rdd.getNumPartitions() 2) print out the execution plan of the of the Spark job with df.explain(). – abiratsis Apr 01 '19 at 10:22
  • Before any joining happen, the df.rdd.getNumPartitions() returns 100 on biggest table after the SQL execution, df.rdd.getNumPartitions() returns 200 – OysterSing Apr 01 '19 at 10:35
  • the df.explain() output is too large for stackoverflow – OysterSing Apr 01 '19 at 10:35
  • What about spark.driver.maxResultSize? – OysterSing Apr 01 '19 at 10:37
  • Hi @MagnusTheStrong the number of 200 is very low. That means you didn't apply the repartition that I suggested. Your problem looks common so if you dont manage to increase partitions you will not be able to solve the issue. I wrote above how to calculate approximately the right number of partitions (num_partitions = total_data / 500MB) please let me know if it is clear. I also wrote above that to increase the default number of partitions you can set the spark.sql.shuffle.partitions option of Spark before executing your Spark SQL queries. – abiratsis Apr 01 '19 at 10:50
  • Hi Alexandros, but my tables are super small, Statistics |5824250981 bytes, 328505785 rows – OysterSing Apr 01 '19 at 10:59
  • Let us [continue this discussion in chat](https://chat.stackoverflow.com/rooms/191017/discussion-between-magnusthestrong-and-alexandros-biratsis). – OysterSing Apr 01 '19 at 11:03