Here's the second way (again, where the vertical axis increases going down). This method is easier to layout, but has less control over the format of the numeric values displayed in the plot.
library(plotrix)
#Build the matrix data to look like a correlation matrix
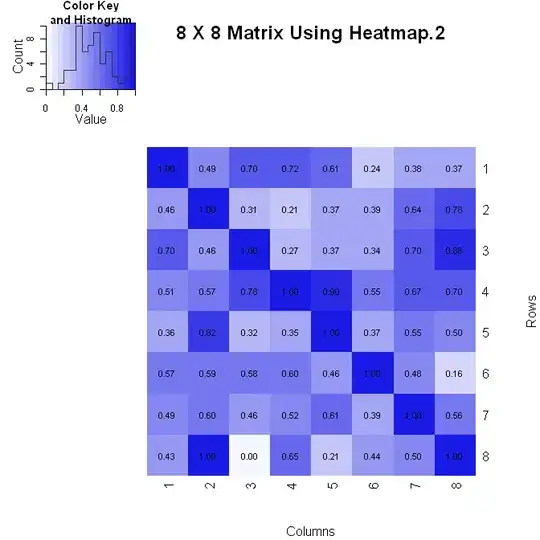
n <- 8
x <- matrix(runif(n*n), nrow=n)
xmin <- 0
xmax <- 1
for (i in 1:n) x[i, i] <- 1.0 #Make the diagonal all 1's
#Generate the palette for the matrix and the legend. Generate labels for the legend
palmat <- color.scale(x, c(1, 0.4), c(1, 0.4), c(0.96, 1))
palleg <- color.gradient(c(1, 0.4), c(1, 0.4), c(0.96, 1), nslices=100)
lableg <- c(formatC(xmin, format="f", digits=2), formatC(1*(xmax-xmin)/4, format="f", digits=2), formatC(2*(xmax-xmin)/4, format="f", digits=2), formatC(3*(xmax-xmin)/4, format="f", digits=2), formatC(xmax, format="f", digits=2))
#Set up the plot area and plot the matrix
par(mar=c(5, 5, 5, 8))
color2D.matplot(x, cellcolors=palmat, main=paste(n, " X ", n, " Matrix Using Color2D.matplot", sep=""), show.values=2, vcol=rgb(0,0,0), axes=FALSE, vcex=0.7)
axis(1, at=seq(1, n, 1)-0.5, labels=seq(1, n, 1), tck=-0.01, padj=-1)
#In the axis() statement below, note that the labels are decreasing. This is because
#the above color2D.matplot() statement has "axes=FALSE" and a normal axis()
#statement was used.
axis(2, at=seq(1, n, 1)-0.5, labels=seq(n, 1, -1), tck=-0.01, padj=0.7)
#Plot the legend
pardat <- par()
color.legend(pardat$usr[2]+0.5, 0, pardat$usr[2]+1, pardat$usr[2], paste(" ", lableg, sep=""), palleg, align="rb", gradient="y", cex=0.7)