I have a 1000*1000 matrix (which only includes integer 0 and 1), but when I tried to make a heatmap, an error occurs because it is too large.
How can I create a heatmap with such a large matrix?
I have a 1000*1000 matrix (which only includes integer 0 and 1), but when I tried to make a heatmap, an error occurs because it is too large.
How can I create a heatmap with such a large matrix?
I can believe that the heatmap is, at least, taking a long time, because heatmap does a lot of fancy stuff that takes extra time and memory. Using dat from @bill_080's example:
## basic command: 66 seconds
t0 <- system.time(heatmap(dat))
## don't reorder rows & columns: 43 seconds
t1 <- system.time(heatmap(dat,Rowv=NA))
## remove most fancy stuff (from ?heatmap): 14 seconds
t2 <- system.time( heatmap(dat, Rowv = NA, Colv = NA, scale="column",
             main = "heatmap(*, NA, NA) ~= image(t(x))"))
## image only: 13 seconds
t3  <- system.time(image(dat))
## image using raster capability in R 2.13.0: 1.2 seconds
t4 <- system.time(image(dat,useRaster=TRUE))
You might want to consider what you really want out of the heatmap -- i.e., do you need the fancy dendrogram/reordering stuff?
No errors when I try it. Here's the code:
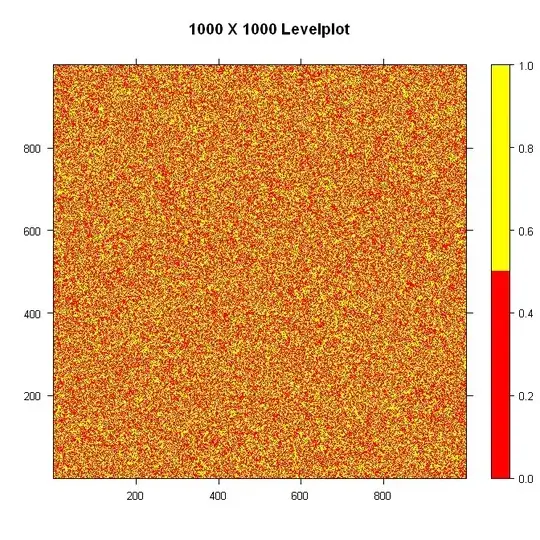
 library(lattice)

 #Build the data
 nrowcol <- 1000
 dat <- matrix(ifelse(runif(nrowcol*nrowcol) > 0.5, 1, 0), nrow=nrowcol)

 #Build the palette and plot it
 pal <- colorRampPalette(c("red", "yellow"), space = "rgb")
 levelplot(dat, main="1000 X 1000 Levelplot", xlab="", ylab="", col.regions=pal(4), cuts=3, at=seq(0,1,0.5))
Using heatmap3, which is more memory efficient than the default heatmap function and faster through it's use of the fastcluster package to do the hierarchical clustering works fine for me. Adding argument useRaster=TRUE also helps :
library(heatmap3)
nrowcol <- 1000
dat <- matrix(ifelse(runif(nrowcol*nrowcol) > 0.5, 1, 0), nrow=nrowcol)
heatmap3(dat,useRaster=TRUE)
The useRaster=TRUE seems quite important to keep memory use within limits. You can use the same argument in heatmap.2. Calculating the distance matrix for the hierarchical clustering is the main overhead in the calculation, but heatmap3 uses the more efficient fastcluster package for that for large matrices. With very large matrices you will unavoidably get into trouble though trying to do a distance-based hierarchical cluster. In that case you can still use arguments Rowv=NA and Colv=NA to suppress the row and column dendrograms and use some other logic to sort your rows and columns, e.g.
nrowcol <- 5000
dat <- matrix(ifelse(runif(nrowcol*nrowcol) > 0.5, 1, 0), nrow=nrowcol)
heatmap3(dat,useRaster=TRUE,Rowv=NA,Colv=NA)
still runs without problems on my laptop with 8 Gb memory, whereas with the dendrograms included it already starts to crunch.
You can also use heatmap.2 from the gplots package and simply turn off dendrograms, as these normally take up the most computation time (from my experience).
Also, have you considered directly printing your heatmap to a file via pdf(), png() or jpeg()?