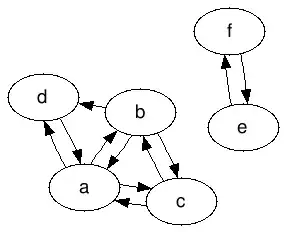
I want to visualise a network, such that the nodes are aligned on a vertical axis based on a variable of each node. It's a little hard to explain, but here is a (low quality) image

So each node has a value, and the graph is visualised so these values align on the vertical axis. In the image above, the green nodes have value between 0 and 1, the blue nodes have value between 1 and 2, the yellow nodes have value of at least 2.
Any ideas how I can acheive this in Python, if I satrt with an adjacency matrix?