13

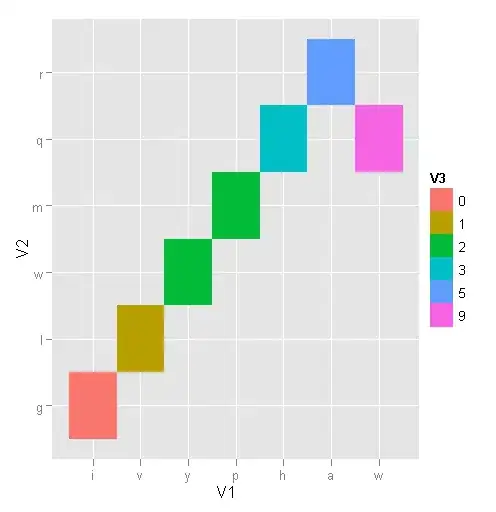
i have a data frame and i want to generate a geom_tile() plot from it , but I want the graph to be ordered not based on the alphabetic but based on a variable inside this data frame.

structure(list(V1 = c("a", "y", "w", "p", "v", "h", "i"), 
    V2 = c("r", "w", "q", "m", "l", "q", "g"), V3 = c( 
    "5", "2", "9", "2", "1", "3", "0")), .Names = c("V1", "V2", 
"V3"), class = "data.frame", row.names = c(NA, -8L))

I want to order the plot based in the variable V3 , because the normal plotting will order them based on the alphabetic in V1 and V2 .

How this can be done ??

Gavin Simpson
  • 170,508
  • 25
  • 396
  • 453
weblover
  • 371
  • 2
  • 7
  • 15
  • 2
    so what's the x-axis and y-axis? V1 and V2? Are they factors? What do you mean reorder based on V3? Your sample data indicates they are all of class character, which seems strange to me. What code have you tried? Why doesn't it work the way you want it to? What is the desired output? You have to help us help you...nobody is here to read your mind. – Chase Apr 19 '11 at 16:41
  • @Chase : V1 is x-axis and V2 is y-axis , V3 are factores but V1 and V2 are characters , i want to plot this data ordered based on V3. i tried this : test[with(test, order(-V3)), ] and when i print the data frame it will be printed in ordered way , but when i plot it , it will be plotted based on alphabetics in V1 and V2, and not based on the order. – weblover Apr 20 '11 at 07:01
  • try running `str()` on the example code you posted above. All three columns are of class character. If you are going to provide example data, please make it representative of your real dataset, it does have an impact on the resulting answers. Secondly - please think more about what information you include in your questions when you first post them. It shouldn't take several follow ups via comments and edits to get to the heart of what you want. – Chase Apr 20 '11 at 13:33

2 Answers2

19

As an answer to the duplicate question, here's a solution that uses ggplot directly and does not require changing the data.

x <- structure(list(V1 = c("a", "y", "w", "p", "v", "h", "i"), 
                    V2 = c("r", "w", "q", "m", "l", "q", "g"), 
                    V3 = c( "5", "2", "9", "2", "1", "3", "0")), 
               .Names = c("V1", "V2", "V3"), class = "data.frame", 
               row.names = c(NA, -8L))

x <- x[1:7,]

ggplot(x, aes(V1, V2, fill=V3)) + geom_tile() +
  scale_x_discrete(limits=(x$V1)[order(x$V3)]) + 
  scale_y_discrete(limits=(x$V2)[order(x$V3)])
Community
  • 1
  • 1
shadow
  • 21,823
  • 4
  • 63
  • 77
19

I usually try to use levels to fix my data before hand:

x <- structure(list(V1 = c("a", "y", "w", "p", "v", "h", "i"), 
    V2 = c("r", "w", "q", "m", "l", "q", "g"), V3 = c( 
    "5", "2", "9", "2", "1", "3", "0")), .Names = c("V1", "V2", 
"V3"), class = "data.frame", row.names = c(NA, -8L))

x <- x[1:7,]

x$V1 <- factor(x$V1, levels=(x$V1)[order(x$V3)])

# Note it's not an ordered factor, it's a factor in the right order

ggplot(x, aes(V1, V3)) + geom_tile()

enter image description here

UPDATE:

Still not exactly clear on your dimensions, but perhaps something like:

x$V2 <- factor(x$V2, levels=(x$V2)[order(x$V3)])

ggplot(x, aes(V1,V2,fill=V3)) + geom_tile() 

enter image description here

Brandon Bertelsen
  • 43,807
  • 34
  • 160
  • 255
  • thanks for your help , but what i want is that V1 is on x-axis , V2 is on y-axis and V3 is the data , and i want the plot to be ordered based on V3 , for example ( all the large values will be on the upper left , and small values are on the down right) – weblover Apr 20 '11 at 07:03
  • thank you for your help that's what i needed , but it's giving me an error when i try it ?? Error in `$<-.data.frame`(`*tmp*`, "xp", value = integer(0)) : replacement has 0 rows, data has 7 – weblover Apr 20 '11 at 08:09
  • i was able to solve the error , it was a mistake of me , but when i plot the data , the x-axis does not have a label only (NA) why ?? – weblover Apr 20 '11 at 08:13
  • This step above is still necessary x <- x[1:7,] (pulls the first 7 rows). Not sure why but your structure dumps an NA row at the bottom (row 8). That's why the NA shows up. – Brandon Bertelsen Apr 20 '11 at 15:45