2

In JFreeChart I used to generate the chart with CategoryDataset and with createLineChart. This looked like this:

enter image description here

Due to some axis changes I had to switch to XYLineAndShapeRenderer, and now the chart looks like this: enter image description here
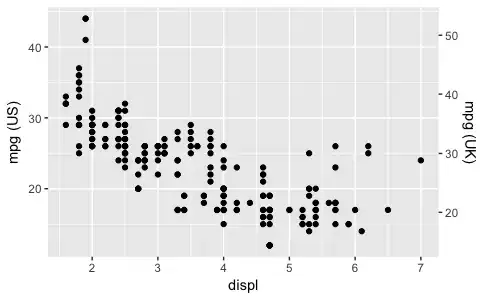
Please notice the gray area around the chart. I want to change it to transparent or at least white just like it was on the old one above.

I tried doing it by:

chart.getPlot().setBackgroundPaint(Color.WHITE);

But it does not work.

How can I change that background to white, and change the plot's background to gray (just like it was on the old one?)

Thanks!

UPDATE

I can update the plot's background, but not the ChartPanel's.

Here is the diagram which has these options:

lineChart.getPlot().setBackgroundPaint(Color.red);
chartPanel.setBackground(Color.yellow);

enter image description here

Here I would like to have the yellow as the background of the chartPanel.

Daniel
  • 2,318
  • 2
  • 22
  • 53
  • The temperature demo shown [here](https://stackoverflow.com/a/57544811/230513) has those colors by default; the factory applies the standard chart theme. – trashgod Aug 22 '19 at 10:20
  • Is it possible that they looks different on different OSes? These shots are taken from a Tomcat web server. – Daniel Aug 22 '19 at 15:40
  • Yes, or different chart themes or different versions of the [tag:jfreechart) library itself; note also that the chart and plot can have different background paints. – trashgod Aug 22 '19 at 18:43
  • Okay, so at the point when I change from _CategoryPlot_ to _XYPlot_ along with _XYLineAndShapeRenderer_ the background colors change as shown in the question. So it is still valid: how can I ask _XYPlot_ to have a gray background? – Daniel Aug 22 '19 at 20:14
  • To be more exact I've updated the Q. – Daniel Aug 22 '19 at 20:29
  • Okay, it was a user error. The gray area was not the chartPanel, but the JFreeChart itself, so background can be set by _lineChart.setBackgroundPaint(Color.pink);_ – Daniel Aug 22 '19 at 21:13
  • 1
    You can [answer your own question](http://meta.stackoverflow.com/q/17463/163188). – trashgod Aug 23 '19 at 01:41

1 Answers1

2

It was a user error. The gray area around the plot was not the ChartPanel but the JFreeChart itself. The chart and plot backgrounds can be set separately, for example:

lineChart.setBackgroundPaint(Color.pink);
plot.setBackgroundPaint(Color.cyan.darker());

A complete example for testing is seen here.

background colors

trashgod
  • 203,806
  • 29
  • 246
  • 1,045
Daniel
  • 2,318
  • 2
  • 22
  • 53