3

I have a JFreeChart chart with DateAxis as domain. It looks very nice, however the last axis label sometimes goes out of the chart area. Here is the sample code to reproduce:

public class LineChart_AWT extends ApplicationFrame {

    public LineChart_AWT( String applicationTitle , String chartTitle ) {
          super(applicationTitle);

          ValueAxis timeAxis = new DateAxis("");
          NumberAxis valueAxis = new NumberAxis("Number");
          ((DateAxis)timeAxis).setDateFormatOverride(new SimpleDateFormat("YYYY-MM-dd HH:mm"));
          XYPlot plot = new XYPlot(createDataset(), timeAxis, valueAxis, null);
          XYLineAndShapeRenderer renderer = new XYLineAndShapeRenderer(true, false);

          plot.setRenderer(renderer);
          plot.getRangeAxis().setAutoRange(true);
          ((NumberAxis)plot.getRangeAxis()).setAutoRangeIncludesZero(false);
          JFreeChart lineChart = new JFreeChart(chartTitle, plot);
          plot.setBackgroundPaint(Color.lightGray);

          plot.setDomainGridlinesVisible(true);
          plot.setRangeGridlinesVisible(true);
          plot.setDomainGridlinePaint(Color.white);
          plot.setRangeGridlinePaint(Color.white);

          lineChart.setBackgroundPaint(Color.white);
          ChartPanel chartPanel = new ChartPanel( lineChart );
          chartPanel.setPreferredSize( new java.awt.Dimension( 560 , 367 ) );
          setContentPane( chartPanel );
       }

       private TimeSeriesCollection createDataset( ) {
           TimeSeries typeA = new TimeSeries("TypeA");
         TimeSeries typeB = new TimeSeries("TypeB");
         TimeSeriesCollection collection = new TimeSeriesCollection();

         collection.addSeries(typeA);
         collection.addSeries(typeB);
         typeA = collection.getSeries("TypeA");

         typeA.add(new Hour(8, new Day()), 1.0);
         typeA.add(new Hour(10, new Day()), 1.0);
         typeA.add(new Hour(11, new Day()), 1.0);
         typeA.add(new Hour(13, new Day()), 1.0);
         typeA.add(new Hour(16, new Day()), 2.0);
         typeA.add(new Hour(18, new Day()), 2.0);

         typeB.add(new Hour(8, new Day()), 1.0);
         typeB.add(new Hour(19, new Day()), 2.0);
         typeB.add(new Hour(20, new Day()), 5.0);


          return collection;
       }

       public static void main( String[ ] args ) {
          LineChart_AWT chart = new LineChart_AWT(
             "X-axis demo" ,
             "X-axis labels are truncated");

          chart.pack( );
          RefineryUtilities.centerFrameOnScreen( chart );
          chart.setVisible( true );
       }
    }

Here is the current screenshot; problem can be seen on the last label:

date labels clipped

What causes that last label to be rendered outside of the current chart area? Also, how can I prevent it?

UPDATE

Here is a more comprehensive example with screenshots and all the details.

According to @trashgod's comments, I've updated to the latest JFreeChart Engine (jfreechart-1.0.19.jar and jcommon-1.0.23.jar) (jfreechart-1.6.0-snapshot.jar).

Consider this example (which deeply relies on @trashgod's suggestions - thank you very much):

import java.awt.Color;
import java.awt.Dimension;
import java.awt.EventQueue;
import java.text.SimpleDateFormat;
import org.jfree.chart.ChartPanel;
import org.jfree.chart.JFreeChart;
import org.jfree.chart.axis.DateAxis;
import org.jfree.chart.axis.NumberAxis;
import org.jfree.chart.plot.XYPlot;
import org.jfree.chart.renderer.xy.XYLineAndShapeRenderer;
import org.jfree.chart.ui.ApplicationFrame;
import org.jfree.data.time.Minute;
import org.jfree.data.time.TimeSeries;
import org.jfree.data.time.TimeSeriesCollection;

/**
 * @see https://stackoverflow.com/a/57637615/230513
 * @see https://stackoverflow.com/a/57544811/230513
 */
public class TimeChart extends ApplicationFrame {

    private static boolean lot_of_values = false;

    public TimeChart(String applicationTitle, String chartTitle) {
        super(applicationTitle);

        DateAxis timeAxis = new DateAxis("Timestamp");
        timeAxis.setUpperMargin(DateAxis.DEFAULT_UPPER_MARGIN /* * 2*/); // UPDATED
        timeAxis.setLowerMargin(DateAxis.DEFAULT_LOWER_MARGIN /* * 2*/); // UPDATED
        timeAxis.setDateFormatOverride(new SimpleDateFormat("YYYY-MM-dd HH:mm"));
        NumberAxis numberAxis = new NumberAxis("Number");
        numberAxis.setAutoRangeIncludesZero(false);
        XYLineAndShapeRenderer renderer = new XYLineAndShapeRenderer(true, false);
        XYPlot plot = new XYPlot(createDataset(), timeAxis, numberAxis, renderer);
        plot.setBackgroundPaint(Color.lightGray);
        plot.setDomainGridlinePaint(Color.white);
        plot.setRangeGridlinePaint(Color.white);
        JFreeChart lineChart = new JFreeChart(chartTitle, plot);
        lineChart.setBackgroundPaint(Color.white);
        ChartPanel chartPanel = new ChartPanel(lineChart) {
            @Override
            public Dimension getPreferredSize() {
                return new Dimension(1529 , 538);
            }
        };
        add(chartPanel);
    }

    private TimeSeriesCollection createDataset() {

        TimeSeries typeA = new TimeSeries("Temperatures");
        TimeSeriesCollection collection = new TimeSeriesCollection();

        collection.addSeries(typeA);

        if (lot_of_values) {
            typeA.add(Minute.parseMinute("2019-08-25 00:00"), 26.68);
            typeA.add(Minute.parseMinute("2019-08-25 01:00"), 26.75);
            typeA.add(Minute.parseMinute("2019-08-25 02:00"), 25.95);
            typeA.add(Minute.parseMinute("2019-08-25 03:00"), 25.47);
            typeA.add(Minute.parseMinute("2019-08-25 04:00"), 25.19);
            typeA.add(Minute.parseMinute("2019-08-25 05:00"), 24.65);
            typeA.add(Minute.parseMinute("2019-08-25 06:00"), 24.61);
            typeA.add(Minute.parseMinute("2019-08-25 07:00"), 25.58);
            typeA.add(Minute.parseMinute("2019-08-25 08:00"), 26.43);
            typeA.add(Minute.parseMinute("2019-08-25 09:00"), 26.96);
            typeA.add(Minute.parseMinute("2019-08-25 10:00"), 27.81);
            typeA.add(Minute.parseMinute("2019-08-25 11:00"), 28.69);
            typeA.add(Minute.parseMinute("2019-08-25 12:00"), 29.39);
            typeA.add(Minute.parseMinute("2019-08-25 13:00"), 29.89);
            typeA.add(Minute.parseMinute("2019-08-25 14:00"), 30.32);
            typeA.add(Minute.parseMinute("2019-08-25 15:00"), 30.69);
            typeA.add(Minute.parseMinute("2019-08-25 16:00"), 30.83);
            typeA.add(Minute.parseMinute("2019-08-25 17:00"), 30.85);
            typeA.add(Minute.parseMinute("2019-08-25 18:00"), 30.64);
            typeA.add(Minute.parseMinute("2019-08-25 19:00"), 30.04);
            typeA.add(Minute.parseMinute("2019-08-25 20:00"), 29.51);
            typeA.add(Minute.parseMinute("2019-08-25 21:00"), 28.63);
            typeA.add(Minute.parseMinute("2019-08-25 22:00"), 28.48);
            typeA.add(Minute.parseMinute("2019-08-25 23:00"), 27.15);
            typeA.add(Minute.parseMinute("2019-08-26 00:00"), 27.3);
            typeA.add(Minute.parseMinute("2019-08-26 01:00"), 27.05);
            typeA.add(Minute.parseMinute("2019-08-26 02:00"), 26.84);
            typeA.add(Minute.parseMinute("2019-08-26 03:00"), 26.47);
            typeA.add(Minute.parseMinute("2019-08-26 04:00"), 26.34);
            typeA.add(Minute.parseMinute("2019-08-26 05:00"), 25.95);
            typeA.add(Minute.parseMinute("2019-08-26 06:00"), 26.46);
            typeA.add(Minute.parseMinute("2019-08-26 07:00"), 26.75);
            typeA.add(Minute.parseMinute("2019-08-26 08:00"), 26.94);
            typeA.add(Minute.parseMinute("2019-08-26 09:00"), 27.05);
            typeA.add(Minute.parseMinute("2019-08-26 10:00"), 27.35);
            typeA.add(Minute.parseMinute("2019-08-26 11:00"), 27.67);
            typeA.add(Minute.parseMinute("2019-08-26 12:00"), 28.12);
            typeA.add(Minute.parseMinute("2019-08-26 13:00"), 28.41);
            typeA.add(Minute.parseMinute("2019-08-26 14:00"), 28.67);
            typeA.add(Minute.parseMinute("2019-08-26 15:00"), 28.99);
            typeA.add(Minute.parseMinute("2019-08-26 16:00"), 28.99);
            typeA.add(Minute.parseMinute("2019-08-26 17:00"), 29.02);
            typeA.add(Minute.parseMinute("2019-08-26 18:00"), 29.02);
            typeA.add(Minute.parseMinute("2019-08-26 19:00"), 28.43);
            typeA.add(Minute.parseMinute("2019-08-26 20:00"), 27.87);
            typeA.add(Minute.parseMinute("2019-08-26 21:00"), 27.2);
            typeA.add(Minute.parseMinute("2019-08-26 22:00"), 26.88);
            typeA.add(Minute.parseMinute("2019-08-26 23:00"), 26.31);
            typeA.add(Minute.parseMinute("2019-08-27 00:00"), 26.02);
            typeA.add(Minute.parseMinute("2019-08-27 01:00"), 25.51);
            typeA.add(Minute.parseMinute("2019-08-27 02:00"), 25.12);
            typeA.add(Minute.parseMinute("2019-08-27 03:00"), 25.11);
            typeA.add(Minute.parseMinute("2019-08-27 04:00"), 24.97);
            typeA.add(Minute.parseMinute("2019-08-27 05:00"), 24.85);
            typeA.add(Minute.parseMinute("2019-08-27 06:00"), 24.73);
            typeA.add(Minute.parseMinute("2019-08-27 07:00"), 25.04);
            typeA.add(Minute.parseMinute("2019-08-27 08:00"), 25.68);
            typeA.add(Minute.parseMinute("2019-08-27 09:00"), 26.22);
            typeA.add(Minute.parseMinute("2019-08-27 10:00"), 26.69);
            typeA.add(Minute.parseMinute("2019-08-27 11:00"), 27.3);
            typeA.add(Minute.parseMinute("2019-08-27 12:00"), 27.84);
            typeA.add(Minute.parseMinute("2019-08-27 13:00"), 28.26);
            typeA.add(Minute.parseMinute("2019-08-27 14:00"), 28.6);
            typeA.add(Minute.parseMinute("2019-08-27 15:00"), 29.03);
            typeA.add(Minute.parseMinute("2019-08-27 16:00"), 29.38);
            typeA.add(Minute.parseMinute("2019-08-27 17:00"), 29.62);
            typeA.add(Minute.parseMinute("2019-08-27 18:00"), 29.47);
            typeA.add(Minute.parseMinute("2019-08-27 19:00"), 29.01);
            typeA.add(Minute.parseMinute("2019-08-27 20:00"), 28.31);
            typeA.add(Minute.parseMinute("2019-08-27 21:00"), 27.69);
            typeA.add(Minute.parseMinute("2019-08-27 22:00"), 26.93);
            typeA.add(Minute.parseMinute("2019-08-27 23:00"), 26.37);
        }

        typeA.add(Minute.parseMinute("2019-08-28 00:00"), 26.12);
        typeA.add(Minute.parseMinute("2019-08-28 01:00"), 25.77);
        typeA.add(Minute.parseMinute("2019-08-28 02:00"), 25.42);
        typeA.add(Minute.parseMinute("2019-08-28 03:00"), 25.0);
        typeA.add(Minute.parseMinute("2019-08-28 04:00"), 24.57);
        typeA.add(Minute.parseMinute("2019-08-28 05:00"), 24.23);
        typeA.add(Minute.parseMinute("2019-08-28 06:00"), 24.38);
        typeA.add(Minute.parseMinute("2019-08-28 07:00"), 24.99);
        typeA.add(Minute.parseMinute("2019-08-28 08:00"), 25.86);
        typeA.add(Minute.parseMinute("2019-08-28 09:00"), 26.53);
        typeA.add(Minute.parseMinute("2019-08-28 10:00"), 27.32);
        typeA.add(Minute.parseMinute("2019-08-28 11:00"), 27.95);
        typeA.add(Minute.parseMinute("2019-08-28 12:00"), 28.64);
        typeA.add(Minute.parseMinute("2019-08-28 13:00"), 29.38);
        typeA.add(Minute.parseMinute("2019-08-28 14:00"), 29.74);
        typeA.add(Minute.parseMinute("2019-08-28 15:00"), 30.13);
        typeA.add(Minute.parseMinute("2019-08-28 16:00"), 30.42);
        typeA.add(Minute.parseMinute("2019-08-28 17:00"), 30.48);
        typeA.add(Minute.parseMinute("2019-08-28 18:00"), 30.14);
        typeA.add(Minute.parseMinute("2019-08-28 19:00"), 29.41);
        typeA.add(Minute.parseMinute("2019-08-28 20:00"), 28.47);
        typeA.add(Minute.parseMinute("2019-08-28 21:00"), 28.05);


        return collection;
    }

    public static void main(String[] args) {
        EventQueue.invokeLater(new Runnable() {
            @Override
            public void run() {
                TimeChart chart = new TimeChart(
                    "Date axis demo",
                    "Date axis labels are visible");

                chart.pack();
                chart.setVisible(true);
            }
        });
    }
}

Please note that I've changed the preferred diagram size to 1529 x 538 (I will need to generate a PNG with this size), and also I have introduced a new static variable called lot_of_values. Initially, it is set to false, here is a screenshot of this:

enter image description here

However if I change lot_of_values to true (which will add more data to the collection - you can see in the source), the last label of the domain axis will be cut. Here is the screenshot with lot_of_values=true:

enter image description here

UPDATE2

I have digged myself into JFreeChart's sources and I'm on the way of solving the problem. (also I had to remove some lines from the source above to fit into the 30k characters limit)

Consider the following screenshot: enter image description here
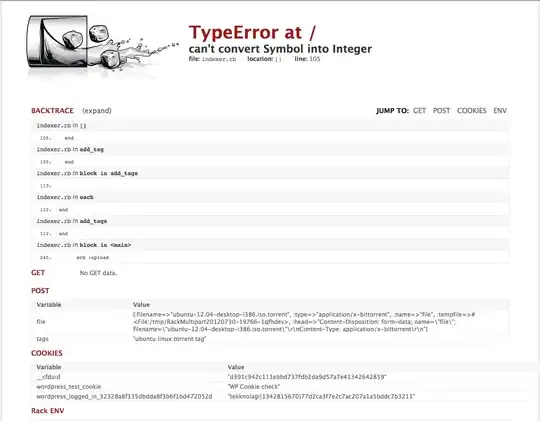
I think margin values are applied before and after the chart's current data plotting and not to the current range ticks. That's why the last tick label can be cut.

It won't be a problem if the data would fill up until the last tick (currently 2019-08-29 00:00) because in that case the margin would allow that value to be printed correctly.

Let's see a proof-of-concept for this. I added three lines to the dataset:

typeA.add(Minute.parseMinute("2019-08-28 21:00"), 28.05); //original line
typeA.add(Minute.parseMinute("2019-08-28 22:00"), 28.05); //new line
typeA.add(Minute.parseMinute("2019-08-28 23:00"), 28.05); //new line
typeA.add(Minute.parseMinute("2019-08-29 00:00"), 28.05); //new line

And now the result: enter image description here

This can be achieved also by modifying the axis's maximum date by calling:

timeAxis.setMaximumDate(new Date(119,7,29,4,36));

Now I will go forward to hunt down where this MaximumDate calculated. If someone know, please let me know.
Daniel
  • 2,318
  • 2
  • 22
  • 53

2 Answers2

2

The effect is an artifact caused by artificially decreasing the chart's preferred size while explicitly increasing the date axis tick label size. Note that omitting the call to setPreferredSize() eliminates the effect. Alternatively, you can set the axis margins to compensate, as suggested here. The example below doubles the default upper and lower margins, going from 10% to 20% of a tick interval.

timeAxis.setUpperMargin(DateAxis.DEFAULT_UPPER_MARGIN * 2);
timeAxis.setLowerMargin(DateAxis.DEFAULT_LOWER_MARGIN * 2);

To make it more exact: is it an ultimate solution for these label lengths or just a particular hack for the current situation?

DateAxis uses the label's calculated size to center the label on its tick/gridline. Because font size varies by platform, and label size varies by format and locale, there is always some combination of values that might clip the label for a given enclosing component size. As the component is resized, the number of labels displayed will change to optimize the display. As long as you allow the chart to adjust as the size changes, discussed here, users will have no trouble. Resize the example's frame or use these built-in controls to see the effect.

I do not want to hard-wire the dataset; the chart has to look good with all record counts—even if I have only 1 record, or I have 100s.

To this end, guide users to interactive features suitable to your use case: This example uses a combo box listener to toggle setVerticalTickLabels(); you can persist the user's preference as shown here. This example offers a toolbar of zoom controls. The examples cited here combine panning with setMouseWheelEnabled().

As an side, don't neglect the other issues mentioned here, as they are common pitfalls that can make other problems hard to isolate.

margins doubled

import java.awt.Color;
import java.awt.Dimension;
import java.awt.EventQueue;
import java.text.SimpleDateFormat;
import org.jfree.chart.ChartPanel;
import org.jfree.chart.JFreeChart;
import org.jfree.chart.axis.DateAxis;
import org.jfree.chart.axis.NumberAxis;
import org.jfree.chart.plot.XYPlot;
import org.jfree.chart.renderer.xy.XYLineAndShapeRenderer;
import org.jfree.chart.ui.ApplicationFrame;
import org.jfree.chart.ui.UIUtils;
import org.jfree.data.time.Day;
import org.jfree.data.time.Hour;
import org.jfree.data.time.TimeSeries;
import org.jfree.data.time.TimeSeriesCollection;

/**
 * @see https://stackoverflow.com/a/57637615/230513
 * @see https://stackoverflow.com/a/57544811/230513
 */
public class TimeChart extends ApplicationFrame {

    public TimeChart(String applicationTitle, String chartTitle) {
        super(applicationTitle);

        DateAxis timeAxis = new DateAxis("Timestamp");
        timeAxis.setUpperMargin(DateAxis.DEFAULT_UPPER_MARGIN * 2);
        timeAxis.setLowerMargin(DateAxis.DEFAULT_LOWER_MARGIN * 2);
        timeAxis.setDateFormatOverride(new SimpleDateFormat("YYYY-MM-dd HH:mm"));
        NumberAxis numberAxis = new NumberAxis("Number");
        XYLineAndShapeRenderer renderer = new XYLineAndShapeRenderer(true, false);
        XYPlot plot = new XYPlot(createDataset(), timeAxis, numberAxis, renderer);
        plot.setBackgroundPaint(Color.lightGray);
        plot.setDomainGridlinePaint(Color.white);
        plot.setRangeGridlinePaint(Color.white);
        JFreeChart lineChart = new JFreeChart(chartTitle, plot);
        lineChart.setBackgroundPaint(Color.white);
        ChartPanel chartPanel = new ChartPanel(lineChart) {
            @Override
            public Dimension getPreferredSize() {
                return new Dimension(560 , 367);
            }
        };
        add(chartPanel);
    }

    private TimeSeriesCollection createDataset() {
        TimeSeries typeA = new TimeSeries("TypeA");
        TimeSeries typeB = new TimeSeries("TypeB");
        TimeSeriesCollection collection = new TimeSeriesCollection();

        collection.addSeries(typeA);
        collection.addSeries(typeB);
        typeA = collection.getSeries("TypeA");

        typeA.add(new Hour(8, new Day()), 1.0);
        typeA.add(new Hour(10, new Day()), 1.0);
        typeA.add(new Hour(11, new Day()), 1.0);
        typeA.add(new Hour(13, new Day()), 1.0);
        typeA.add(new Hour(16, new Day()), 2.0);
        typeA.add(new Hour(18, new Day()), 2.0);

        typeB.add(new Hour(8, new Day()), 1.0);
        typeB.add(new Hour(19, new Day()), 2.0);
        typeB.add(new Hour(20, new Day()), 5.0);

        return collection;
    }

    public static void main(String[] args) {
        EventQueue.invokeLater(new Runnable() {
            @Override
            public void run() {
                TimeChart chart = new TimeChart(
                    "Date axis demo",
                    "Date axis labels are visible");
                chart.pack();
                UIUtils.centerFrameOnScreen(chart);
                chart.setVisible(true);
            }
        });
    }
}
trashgod
  • 203,806
  • 29
  • 246
  • 1,045
  • Thanks. Omitting _setPreferredSize()_ for me does not solve the problem. The last 0 of '20:00' is still out of the screen. – Daniel Aug 24 '19 at 21:40
  • I used setPreferredSize() to inform the chart when its parent window is resized. Is this a bad way for doing this? – Daniel Aug 24 '19 at 21:42
  • And I would totally accept if there are less labels on the chart if they won't fit. It's better than having a label which is cut in half. – Daniel Aug 24 '19 at 21:50
  • Yes, font sizes vary by platform; you may need to tweak the margin; also, resize the frame to see the effect; note the effect of adding the chart panel to the frames default border layout center. – trashgod Aug 24 '19 at 23:57
  • I don't really get this now. When resizing the window sometimes gets better sometime worse. Even when decreasing, chart labels can be better, because at a point, JFreechart hides some labels and then the rest have space. What does it mean to add the chart panel to "the frames default border layout center"? Is there a way to have a platform-independent solution for the domain axis' labels? I.e. Render less if have no space. I accept to set margins but it needs to be calculated from the labels' width to be really platform-independent. – Daniel Aug 25 '19 at 09:39
  • The default layout of a `JFrame is ` BorderLayout`; the default destination is `CENTER`, which allows the chart panel to resize; try `DateAxis.DEFAULT_UPPER_MARGIN * 2`. – trashgod Aug 25 '19 at 11:40
  • _DateAxis.DEFAULT_UPPER_MARGIN * 2_ is solving the last label's problem on Windows 10 OS, but I'm curious: can I expect the same for all other conditions? To make it more exact: is it an ultimate solution for these label lengths or just a particular hack for the current situation? – Daniel Aug 25 '19 at 21:02
  • I've elaborated above. – trashgod Aug 26 '19 at 22:58
  • Thanks you. Label clipping occurs again even with the borders set to double of the initials. Okay, I can measure the labels' widths, but how can I know if they are clipped? Note: OS is windows, but chart is displayed in a browser and driven by server side Java. Might not change anything though. – Daniel Aug 27 '19 at 16:02
  • Note: clipping only occurs when I add more data to the chart. (Not longer labels, only more data) – Daniel Aug 27 '19 at 16:03
  • Another idea: is jfreechart generate an event when it renders outside its area? This way I could enlarge the margin on demand. – Daniel Aug 27 '19 at 16:16
  • You could try adding an `AxisChangeEvent`, but I suspect you're seeing something I'm not seeing. – trashgod Aug 28 '19 at 03:11
  • I see you're using an older version; you may be seeing this [bug](https://github.com/jfree/jfreechart/issues/25), fixed in v1.5. – trashgod Aug 28 '19 at 09:59
  • I've updated the question with a more comprehensive example of the current situation. It includes all your very nice suggestions. Please take a look at it, I'm sure I just miss something obvious here. – Daniel Aug 28 '19 at 19:50
  • As you're using a larger preferred size, it looks OK with the default margins. BTW, JFreeChart v1.5 is current. – trashgod Aug 29 '19 at 01:29
  • Oh, I have updated to v1.5. (JFreeChart's project page directed me to SourceForge and they have there only the 1.0.x branch). Yes, default margin looks okay _initially_, but if you comment out a few data (just like I did in the new update), last domain label gets screwed up again. I do not want to hard-wire the dataset, chart has to look good with all record counts - even if I have only 1 record, or I have 100s. – Daniel Aug 29 '19 at 08:56
  • Also consider vertical timestamps; sorry, I don't have a better solution; please feel free to leave the question open in the interim. – trashgod Aug 29 '19 at 17:58
  • Thought for vertical but it looks ugly :) and 45° is not possible with DateAxis if I'm not mistaken. Okay, thanks anyway! – Daniel Aug 30 '19 at 07:30
  • I have also opened an issue on their tracker: https://github.com/jfree/jfreechart/issues/129 – Daniel Aug 30 '19 at 15:01
1

I have successfully investigated and solved this issue.

When JFreeChart decides about the default ticks on its axis, it calculates the width of the labels and checks if they fit in between the ticks, then increases the ticks until the labels will fit.

That's good but during this procedure JFreeChart does not check weather the last label will fit or not into the chart's drawing area.

To overcome this situation you will have two tasks:

  1. check weather your last label is cut or no
  2. if it's cut correct the axis's range

Here is how I have done this, trying to be as minimal as possible while not touching JFreeChart's source at all:

import java.awt.Font;
import java.awt.FontMetrics;
import java.awt.Graphics2D;
import java.awt.font.FontRenderContext;
import java.awt.font.LineMetrics;
import java.awt.geom.Rectangle2D;
import java.text.DateFormat;
import java.util.Date;
import java.util.Locale;
import java.util.TimeZone;

import org.jfree.chart.axis.AxisState;
import org.jfree.chart.axis.DateAxis;
import org.jfree.chart.axis.DateTickUnit;
import org.jfree.chart.plot.PlotRenderingInfo;
import org.jfree.chart.ui.RectangleEdge;
import org.jfree.chart.ui.RectangleInsets;
import org.jfree.data.time.DateRange;

public class CorrectedDateAxis extends DateAxis {

    /** For serialization. */
    private static final long serialVersionUID = 0L;


    /**
     * Creates a date axis with no label.
     */
    public CorrectedDateAxis() {
        super(null);
    }

    /**
     * Creates a date axis with the specified label.
     *
     * @param label  the axis label ({@code null} permitted).
     */
    public CorrectedDateAxis(String label) {
        super(label);
    }

    /**
     * Creates a date axis.
     *
     * @param label  the axis label ({@code null} permitted).
     * @param zone  the time zone.
     * @param locale  the locale ({@code null} not permitted).
     */
    public CorrectedDateAxis(String label, TimeZone zone, Locale locale) {
        super(label, zone, locale);
    }

    /**
     * Estimates the maximum width of the tick labels, assuming the specified
     * tick unit is used.
     * <P>
     * Rather than computing the string bounds of every tick on the axis, we
     * just look at two values: the lower bound and the upper bound for the
     * axis.  These two values will usually be representative.
     *
     * @param g2  the graphics device.
     * @param unit  the tick unit to use for calculation.
     *
     * @return The estimated maximum width of the tick labels.
     */
    private double estimateMaximumTickLabelWidth(Graphics2D g2, 
            DateTickUnit unit) {

        RectangleInsets tickLabelInsets = getTickLabelInsets();
        double result = tickLabelInsets.getLeft() + tickLabelInsets.getRight();

        Font tickLabelFont = getTickLabelFont();
        FontRenderContext frc = g2.getFontRenderContext();
        LineMetrics lm = tickLabelFont.getLineMetrics("ABCxyz", frc);
        if (isVerticalTickLabels()) {
            // all tick labels have the same width (equal to the height of
            // the font)...
            result += lm.getHeight();
        }
        else {
            // look at lower and upper bounds...
            DateRange range = (DateRange) getRange();
            Date lower = range.getLowerDate();
            Date upper = range.getUpperDate();
            String lowerStr, upperStr;
            DateFormat formatter = getDateFormatOverride();
            if (formatter != null) {
                lowerStr = formatter.format(lower);
                upperStr = formatter.format(upper);
            }
            else {
                lowerStr = unit.dateToString(lower);
                upperStr = unit.dateToString(upper);
            }
            FontMetrics fm = g2.getFontMetrics(tickLabelFont);
            double w1 = fm.stringWidth(lowerStr);
            double w2 = fm.stringWidth(upperStr);
            result += Math.max(w1, w2);
        }

        return result;
    }   

    @Override
    public AxisState draw(Graphics2D g2, double cursor, Rectangle2D plotArea, Rectangle2D dataArea, RectangleEdge edge,
            PlotRenderingInfo plotState) {

        double labelWidth = estimateMaximumTickLabelWidth(g2, getTickUnit());

        double lastLabelPosition = dateToJava2D(calculateHighestVisibleTickValue(getTickUnit()),
                plotArea, edge);

        if (lastLabelPosition + labelWidth / 2 > plotArea.getMaxX()) {
            double plottingWidthCorrection = plotArea.getX() + (lastLabelPosition + labelWidth / 2) - plotArea.getMaxX();

            // Calculate and set the new corrected maximum date
            setMaximumDate(new Date((long)(getMaximumDate().getTime() + java2DToValue(plottingWidthCorrection, plotArea, edge) - getMinimumDate().getTime())));
        }

        return super.draw(g2, cursor, plotArea, dataArea, edge, plotState);
    }
}

This is an override to the DateAxis class and it does both of the tasks mentioned above.

Note, this subclass contains a lot of codes copied from JFreeChart's DateAxis class because they have defined estimateMaximumTickLabelWidth as private so subclasses are not accessing it.

You can modify the original DateAxis class to define this function as protected, in this way you could skip this function in this subclass.

Here is how it looks like when CorrectedDateAxis steps into the picture and corrects the DateAxis's range:

enter image description here

No more wrong labels at the end!

Daniel
  • 2,318
  • 2
  • 22
  • 53
  • I have used to this code show my last label but my x-axis is custom. The margin before the start label no more exists. Is there any solution to give the margin at the start point of x-axis. I have already tried setUpperMargin() and setLowerMargin(). – Harmeet Kaur May 25 '20 at 09:31
  • If your x-axis is custom, you can override the *draw* function and calculate the best values for the actual area, just as I've done for DateAxis. I think *setUpperMargin* and *setLowerMargin* won't work with this code as my *draw* function does not take those into account, it should not be hard to apply them though. – Daniel Jun 04 '20 at 12:22