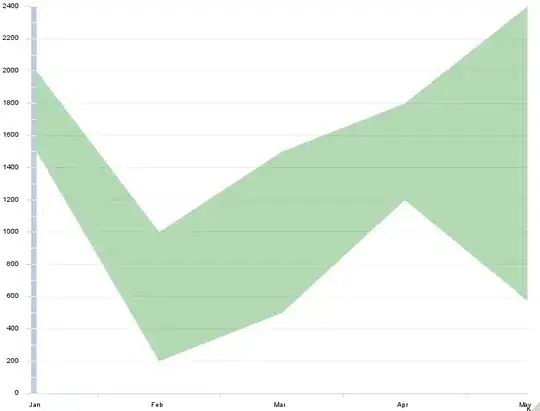
I am trying to create a chart using ggplot2 with multiple grouped bars. In my dataset, I need to choose three columns so that this chart is grouped according to this sketch I made:
CODE:
library(dplyr)
library(tidyr)
library(ggplot2)

DOPTransformationsMean %>%
      select(SPL, AddedFields, ModifiedFields, RemovedFields) %>%
      gather(Var,Val,-SPL) %>%
      ggplot(aes(SPL, Val, group = Var)) +
      ylab("Quantity") +
      geom_bar(stat="identity", width = 0.3) +
      scale_fill_manual(values=c("solid", "solid", "solid")) +
      scale_color_manual(labels = c("Added Fields", "Modified Fields", "Removed Fields"), values=c('#b30000','#00b300','#00b3b3')) +
      theme_bw(base_size = 30) +
      theme(plot.title = element_text(hjust = 0.5), legend.title=element_blank(),legend.position = "bottom", legend.text=element_text(size=27), legend.direction="vertical") +
      scale_y_continuous(breaks = function(x) unique(floor(pretty(seq(0, (max(x) + 1) * 1.1)))))
CODE RESULT:
DATASET:
SPL,AddedClasses,ModifiedClasses,RemovedClasses,AddedMethods,ModifiedMethods,RemovedMethods,AddedImports,RemovedImports,AddedFields,ModifiedFields,RemovedFields
Reminder-PL,49,76,0,99,78,1,43,0,62,0,2
Iris-PL,84,21,4,14,8,0,34,0,2,0,0
I followed a similar example where it is possible to generate a line chart, but by grouping my dataset, I couldn't get the bars to be grouped.


