How to get arrows for the axes when using the command Plot in Mathematica?
Thanks for any helpful answers.
How to get arrows for the axes when using the command Plot in Mathematica?
Thanks for any helpful answers.
For 2D plots such as generated by Plot the following works great:
Plot[Sin[x], {x, 0, 10}, AxesStyle -> Arrowheads[0.07]]

or with custom arrow heads:
h = Graphics[Line[{{-1, 1/2}, {0, 0}, {-1, -1/2}}]];
Plot[Sin[x], {x, 0, 10},
 AxesStyle -> Arrowheads[{{Automatic, Automatic, h}}]]
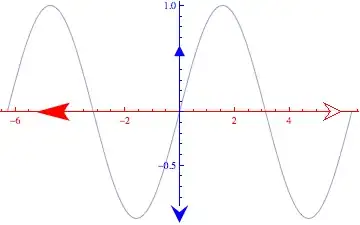
Building on Sjoerd's answer,
a plot such as

may be obtained as follows (for example):
       Plot[Sin[x], {x, -2\[Pi], 2 \[Pi]},

 AxesStyle-> {

Directive[{Red,
Arrowheads[{{-0.06,0(*Xleft*),{Graphics[{
Polygon[
{{-1,0.5`},{0,0},{-1,-0.5`}}]}],0.98`}},
{0.03,.9(*Xright*),{Graphics[{
Polygon[
{{-1,0.5`},{0,0},{-1,-0.5`}}]}],0.98`}}}]}],

Directive[{Blue,
Arrowheads[{{-0.05,0(*Ydown*),{Graphics[{
Polygon[
{{-1,0.5`},{0,0},{-1,-0.5`}}]}],0.98`}},{0.03,.8(*Yup*),{Graphics[{
Polygon[
{{-1,0.5`},{0,0},{-1,-0.5`}}]}],0.98`}}}]}
]}]
There are nice examples of arrowheads given in Drawings Tools and Graphics Inspector. There are probably much better ways of getting the info but I annotate a plot with an arrow that I like and then abstract (using a suggestion from Simon):
Cases["Paste-Graphic_Here", Arrowheads[___], Infinity]
To give another example:
The code is as follows
Plot[Sin[x], {x, -2\[Pi],2 \[Pi]},
AxesStyle-> { Directive[{Red,

Arrowheads[{{-0.06,0.1(*Xleft*),
{Graphics[{arrowhead}]/.arrowhead-> arrowhead2,0.98`}},
{0.05,0.95(*Xright*),
{Graphics[{arrowhead}],0.98`}}}]/.arrowhead-> arrowhead4}],

Directive[{Blue,
Arrowheads[{{-0.05,0(*Ydown*),
{Graphics[{arrowhead}]/.arrowhead-> arrowhead3,0.98`}},{0.03,.8(*Yup*),
{Graphics[{arrowhead}]/.arrowhead-> arrowhead1,0.98`}}}]}

]}]
where
arrowhead1=Polygon[{{-1,0.5`},{0,0},{-1,-0.5`}}];

arrowhead2=Polygon[{{-1.5833333333333333`,0.4166666666666667`},{-1.5410500000000003`,0.369283333333333`},{-1.448333333333333`,0.255583333333333`},{-1.3991000000000005`,0.18721666666666673`},{-1.3564666666666663`,0.11826666666666673`},{-1.3268499999999999`,0.05408333333333341`},{-1.3166666666666667`,0.`},{-1.3268499999999999`,-0.048950000000000195`},{-1.3564666666666663`,-0.11228333333333372`},{-1.3991000000000005`,-0.18353333333333333`},{-1.448333333333333`,-0.2562833333333335`},{-1.5410500000000003`,-0.38048333333333345`},{-1.5833333333333333`,-0.43333333333333335`},{0.`,0.`},{-1.5833333333333333`,0.4166666666666667`},{-1.5833333333333333`,0.4166666666666667`}}];

arrowhead3=Polygon[{{-1,0.5`},{0,0},{-1,-0.5`},{-0.6`,0},{-1,0.5`}}];

arrowhead4={{FaceForm[GrayLevel[1]],Polygon[{{-0.6`,0},{-1.`,0.5`},{0.`,0},{-1.`,-0.5`},{-0.6`,0}}],Line[{{-0.6`,0},{-1.`,0.5`},{0.`,0},{-1.`,-0.5`},{-0.6`,0}}]}};

arrowhead5=Polygon[{{-0.6582278481012658`,-0.43037974683544306`},{0.`,0.`},{0.`,0.`},{0.`,0.`},{0.`,0.`},{0.`,0.`},{-0.6455696202531646`,0.43037974683544306`},{-0.4810126582278481`,0.`},{-0.6582278481012658`,-0.43037974683544306`},{-0.6582278481012658`,-0.43037974683544306`}}];
A list of arrowheads 1 to 5:

Here you have a solution posted in https://math.stackexchange.com/
As the solution in the reference is for Plot3D, here I modified (but not improved) it for Plot[ ]:
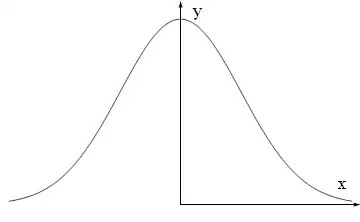
axes[x_, y_, f_, a_] :=
 Graphics[Join[{Arrowheads[a]},
   Arrow[{{0, 0}, #}] & /@ {{x, 0}, {0, y}},
   {Text[Style["x", FontSize -> Scaled[f]], {0.9*x, 0.1*y}],
    Text[Style["y", FontSize -> Scaled[f]], {0.1 x, 0.95*y}]
   }]]

Show[Plot[Exp[-x^2], {x, -2, 2},
       Axes -> None,
       PlotRange -> {{-2.1, 2.1}, {-.1, 1.1}}],
     axes[2, 1, 0.05, 0.02]
]