10

Yesterday, while adding some timing plots to the "Optimally picking one element from each list" question I was once more remembered of a mathgroup posting I did a couple of years ago ("Keeping plot annotations after regenerating a plot").

I was happily annotating my plots (manually) when I thought that some axis labels would be nice. Problem is, regenerating the plots with the axis labels in place will destroy your manual annotations.

It appears you can find user additions in a plot named pic here: Rest[pic[[1, 1]]], so if you regenerate the plot as pic2 you can get your annotations back if you use:

Insert[pic2, Rest[pic[[1, 1]]], {1, 1}]

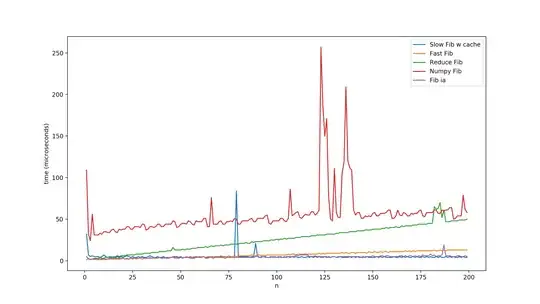
I remember David Park (author of the Presentations package) being vehemently opposed to manual annotations. I have done quite some programmatic labeling myself, but sometimes placing labels under program control is just too difficult, like here (note that I don't like PlotLegends much, especially because some of the colors are close to each other):

top-answerers

It was already too late for my kludge, having thrown away the plot originals, but I wonder what the current state of thinking on this issue is.

  • Are there better ways to do this?
  • How general is this method? Does it work in all plot and chart types?
  • Does it work in all versions? (above 5.2)
  • Any WRI plans to improve handling of user additions in plots?

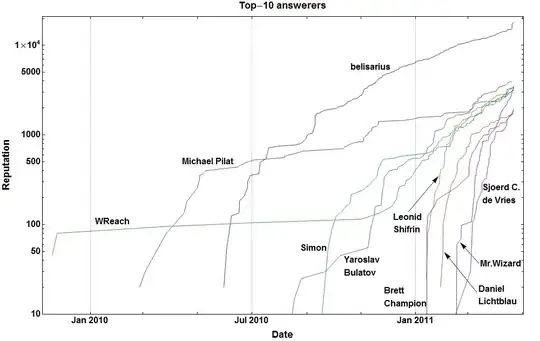
BTW The trick in my mathgroup posting differed slightly from the one shown above and used in the top-10 plot. The principle is the same, though.


EDIT

I placed the code to make SO data plots like the one above in the Mathematica Toolbag.

EDIT

The code is now moved to the more appropriate question by Brett Champion: How do I access the StackOverflow API from Mathematica

Community
  • 1
  • 1
Sjoerd C. de Vries
  • 16,122
  • 3
  • 42
  • 94
  • 3
    +100 for the log-plot! I'd almost believe that the question was just an excuse to show off the plot.... – Simon Apr 21 '11 at 12:42
  • I agree with Simon! Where'd you get the data? – Mark McClure Apr 21 '11 at 12:43
  • @belisarius and @Mark, probably from the [data explorer](http://data.stackexchange.com/) and just grabbed the top 10 mathematica answerers. Sadly, I don't answer enough questions to be on that list ... sigh. – rcollyer Apr 21 '11 at 12:51
  • @rcollyer @belisarius @Mark Nope, I wrote a mma program using the stackoverflow API. – Sjoerd C. de Vries Apr 21 '11 at 12:54
  • @Sjoerd - I didn't know about the API. I've written code to scrape this kind of data off of Google Groups info pages but an API should be much more efficient. I assume there's a simple URL query mechanism that you accessed via `Import`? – Mark McClure Apr 21 '11 at 12:57
  • @Sjeord, now that's just cheating! :) So, being a programming site and all, are you going to post the code? – rcollyer Apr 21 '11 at 12:58
  • @rcollyer I put it temporarily in an answer. Not sure where one is supposed to post such a thing without questions. – Sjoerd C. de Vries Apr 21 '11 at 13:10
  • @rcoller You're in the top 20, but showing the top-20 made for a rather busy graph – Sjoerd C. de Vries Apr 21 '11 at 13:29
  • @Sjeord, actually, I'm 15th, but I was much higher, once. Alas, life (and school) intervenes and I cannot spend my days trying to outrace everyone to the answer. – rcollyer Apr 21 '11 at 14:38
  • @rcollyer I'm currently at a point in my career where I have time to do some stuff here (that's quite an euphemism unfortunately), but I'm surprised at my difficulty to find a question that's not already answered within minutes. PS it's @Sjoerd, not @Sjeord. The latter won't send me a message. – Sjoerd C. de Vries Apr 21 '11 at 15:44
  • @Sjoerd, my apologies, I did not notice the misspelling, but then again neither did you, for a while at least. – rcollyer Apr 21 '11 at 16:22
  • 1
    @Sjoerd, by the way, within the limits of my US American tongue, how do I pronounce your name? – Mr.Wizard Apr 21 '11 at 16:51
  • 2
    @Mr.Wizard like the 'sured' part in 'insured' with a clear 'y' as in 'yellow' before the 'u' sound. Hope that's somewhat clear. It's a Frysian name (northern part of the Netherlands), just like my family name. The latter is one of the most common family names in the Netherlands (also the reason to drag my middle initial around everywhere; there are at least 15 guys named Sjoerd de Vries on LinkeIn; also a pun on a well known tv personality here, the investigative reporter Peter R. de Vries) – Sjoerd C. de Vries Apr 21 '11 at 17:02
  • @Sjoerd Thanks, I think that probably gets me as close as possible without lessons. – Mr.Wizard Apr 21 '11 at 17:29

2 Answers2

5

Personally, I agree with David Park that programmatic addition of annotation is superior. It's also likely to be more robust and work with future editions of Mathematica. I'd really like to see the drawing tools palette improved a bit and I'd like to see multiple annotations added by hand appear in the resulting Graphics object more clearly. If there were an inert Head like AddedAnnotation or some such, then you could find all these edits programmatically via

Cases[editedPic, _AddedAnnotation, Infinity]

As it is, I find myself digging through the InputForm of the image and I'm not certain that your Rest[pic[[1, 1]]] is always going to work, particularly in future versions.

Mark McClure
  • 4,862
  • 21
  • 34
  • This is along the same lines as what I proposed in the mathgroup, but I thought of placing it in an option: Graphics[ {original plot stuff, UserAdditions}, PlotRange->Automatic, etc..., UserAdditions-> {GraphicsStuff, GraphicsStuff} ] – Sjoerd C. de Vries Apr 21 '11 at 14:47
4

One method, which is a bit ugly but seems to work reasonably OK for minor plot annotations, is the following.

After adding annotations via the Drawings tools, the additional info is stored with the graphic and may be inspected by, for example, selecting the graphic bracket and using Show Expression (Shift-Command-E on a Mac). The additional information can usually be picked out by cut-and-paste or using Cases, and then may be added to the new modified plot using Epilog.

For example

Plot[Sin[x], {x, 0, 6 \[Pi]}]

Adding a few annotations gives the following:

enter image description here

Assigning the name plotgraphic to the above image, a new modified plot with added annotations present may be generated as follows (for example)

Labeled[Plot[Sin[x], {x, 0, 8 \[Pi]}, 
  Epilog -> Rest[Cases[plotgraphic, _List][[1]]]], "Sine Plot"]

giving

enter image description here

This can be awkward, to say the least, and the method no doubt can be improved. It is also probably along the lines of what others already do. Nevertheless, it goes give a plot where the annotations are present 'programmatically', and as no-one has mentioned Epilog, I decided it might be worth posting.

681234
  • 4,214
  • 2
  • 35
  • 42