Without a data sample the following is the best suggestion I can give:
Follow the instructions in How to make a reproducible data sample in PowerBI using Python? to make the following table avaibable on your PowerBI Desktop:

Then insert a Python Visual and drag both ID and City over to the visual to make the data available to your Python script:
Insert the following snippet and run it:
# The following code to create a dataframe and remove duplicated rows is always executed and acts as a preamble for your script:

# dataset = pandas.DataFrame(ID, City)
# dataset = dataset.drop_duplicates()

# Paste or type your script code here:
import pandas
import matplotlib.pyplot as plt
#a=dataset.Test_name
plt.bar(dataset['City'], dataset['ID'])
plt.show()
Now you'll have this:

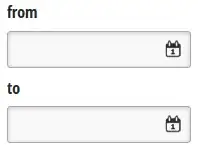
Insert a Slicer and drag ID over to it. Now you can filter your Python visual using that slicer:
Of course, this is not exactly what you're aiming to do here, but it was the best I could do without knowing your data and your data structure. So why is this helpful to you? Well, at least you now know how to set up a bar chart and a slicer using Python and Power BI. And you also know that any errors with this setup will be because of your data.
Let me know how it works out for you.


