I have a plot that I would like to recreate within R. Here is the plot:

From: Boring, E. G. (1941). Statistical frequencies as dynamic equilibria. Psychological Review, 48(4), 279.
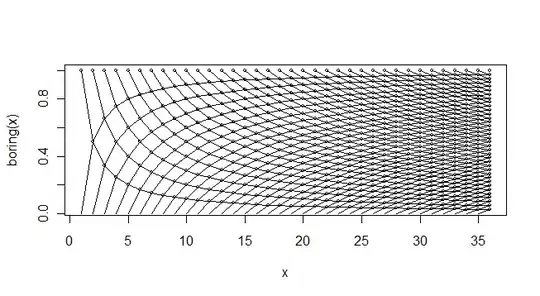
This is a little above my paygrade (abilities) hence asking here. Boring states:
On the first occasion A can occur only 'never' (0) or 'always' (1). On the second occasion the frequencies are 0,1/2, or 1; on the third 0, 1/3, 2/3, or 1 etc, etc.
Obviously, you don't have to worry about labels etc. Just a hint to generate the data and how to plot would be great. ;) I have no clue how to even start...