0

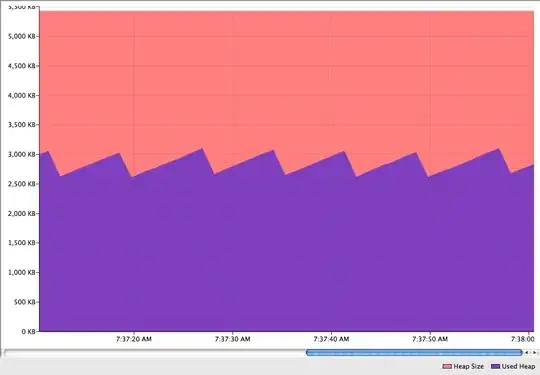
I'm trying to figure out how Google Charts is able to dynamically split the y-Coordinate to achieve the following outcome:

Example 1

Example 2

There are basically two questions that I have. 1) How to dynamically calculate the suited number of y-coordinate separators based on the given ticker prices. 2) How to calculate the steps between these lines.

A similar question has been asked before: Calculating chart for YAxis

But this question is specific to Google's approach of solving the problem.

teylyn
  • 34,374
  • 4
  • 53
  • 73
  • What do you mean with "split the Y coordinates"? Are you talking about the value range for the Y axis, i.e. the minimum/maximum value shown on the axis and the intervals for labels? I assume the min/max values are calculated by looking at the highest and lowest chart value and rounding to a ceiling or floor factor. The intervals are then calculated according to the difference between min and max. – teylyn Dec 23 '19 at 19:00
  • Correct, but in these example they must use some formula to decide how many horizontal separation lines to draw. I don't quite see the correlation between the datapoints and the number of horizontal separations. – Coding4Fun Dec 23 '19 at 19:09
  • 1
    It looks like they don't decide for a number of ticks but for their spacing. The first chart uses a spacing of 10, the second one of 1. So there are probably some pre-defined spacings and they use the one that works best (produces an adequate number of ticks maybe). – Nico Schertler Dec 23 '19 at 19:14
  • A quick survey indicates that they're using a 1,2,5 scheme. Which is to say that they compute the spacing based on 5 lines, then multiply the spacing by a power of 10 so that it's between 1 and 10. Then round to the nearest of 1, 2, 5, or 10, and divide by the same power of 10, to get the spacing. – user3386109 Dec 23 '19 at 20:18
  • See also [nice label algorithm for charts with minimum ticks](https://stackoverflow.com/questions/8506881/nice-label-algorithm-for-charts-with-minimum-ticks/16363437#16363437) – JohanC Dec 24 '19 at 01:52
  • @JohanC Thanks a lot, that is pretty much what I was looking for. – Coding4Fun Dec 24 '19 at 12:19

1 Answers1

0

The number of intervals on the Y axis and its step values are derived from the difference between the minimum and maximum axis value.

Take the difference between floor/ceiling rounded min/max and divide it by either 1, 5 or 10 (or multiples of 5 and 10) to arrive at the interval steps. The number of intervals will differ, but the magnitude of 1, 5 or 10 or its multiples will provide pleasant intervals for the Y axis labels.

In the first example, the difference is 100 points, so it's been divides by 5 to arrive at five intervals, each number ending in a pleasant 0.

In the second example, the difference is 4 points, so it's been divided by 1 to arrive at four intervals.

teylyn
  • 34,374
  • 4
  • 53
  • 73