-1

I have the following data frame dt(head,6):

dt(head, 6)

I need to create a graph in which I have the years (2015, 2016, 2017, 2018, 2019) on the x-axis , different columns (W15, W16, W17, W18, W19 - each one relates to one year) on the y-axis. They are all should be grouped by the column TEAM.

I tried using ggplot2 to no avail.

M--
  • 25,431
  • 8
  • 61
  • 93
  • Welcome to Stackoverflow. Please, see here how to make a great R reproducible example https://stackoverflow.com/questions/5963269/how-to-make-a-great-r-reproducible-example – cmirian Jan 07 '20 at 19:57

2 Answers2

4

You need to convert your data from wide to long and then use ggplot. Look below;

library(tidyverse)

dt %>% 
  pivot_longer(., -Team, values_to = "W", names_to = "Year") %>% 
  mutate(Year = as.integer(gsub("W", "20", Year))) %>% 
  ggplot(., aes(x=Year, y=W, group=Team)) +
  geom_line(aes(color=Team))
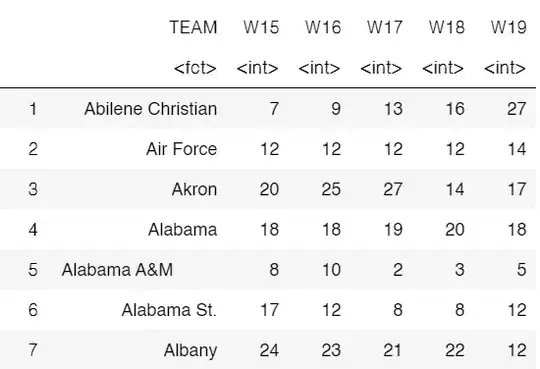
Data:

dt <- structure(list(Team = c("AC", "AF", "AK", "AL", "AA&M", "Alst", "Alb"), 
                     W15 = c(7L, 12L, 20L, 18L, 8L, 17L, 24L), 
                     W16 = c(9L, 12L, 25L, 18L, 10L, 12L, 23L), 
                     W17 = c(13L, 12L, 27L, 19L, 2L, 8L, 21L), 
                     W18 = c(16L, 12L, 14L, 20L, 3L, 8L, 22L), 
                     W19 = c(27L, 14L, 17L, 18L, 5L, 12L, 12L)), 
                class = "data.frame", row.names = c(NA, -7L))
#   Team W15 W16 W17 W18 W19
# 1   AC   7   9  13  16  27
# 2   AF  12  12  12  12  14
# 3   AK  20  25  27  14  17
# 4   AL  18  18  19  20  18
# 5 AA&M   8  10   2   3   5
# 6 Alst  17  12   8   8  12
# 7  Alb  24  23  21  22  12
M--
  • 25,431
  • 8
  • 61
  • 93
0

Create a zoo object z from t(dt[-1]) and the times from the numeric part of the names). Use dt$TEAM as its columnn names. Finally use autoplot.zoo to plot it using ggplot2. Remove facet=NULL if you prefer a separate panel for each series.

library(ggplot2)
library(zoo)

z <- zoo(t(dt[-1]), as.numeric(sub("W", "", names(dt)[-1])))
names(z) <- dt$TEAM

autoplot(z, facet = NULL) + scale_x_continuous(breaks = time(z))

Note

Suppose this input data:

set.seed(123)
dt <- data.frame(TEAM = letters[1:5], W15 = rnorm(5), W16 = rnorm(5), W17 = rnorm(5))
G. Grothendieck
  • 254,981
  • 17
  • 203
  • 341