I would like to label my plot with the label output of a test, eg., LSD test output (a, b, ab, etc) using LSD.test in library agricolae. Here is the running example.
library(ggplot2)
library(agricolae)
wt<-gl(3,4,108,labels=c("W30","W60","W90"))
pl<-gl(3,12,108,labels=c("P0","P1","P2"))
gp<-gl(3,36,108,labels=c("A","B","C"))
dat<-cbind(
A=runif(108),
B=runif(108,min=1,max=10),
C=runif(108,min=100,max=200),
D=runif(108,min=1000,max=1500)
)
dat.df<-data.frame(wt,pl,gp,dat)
dat.m<-melt(dat.df)
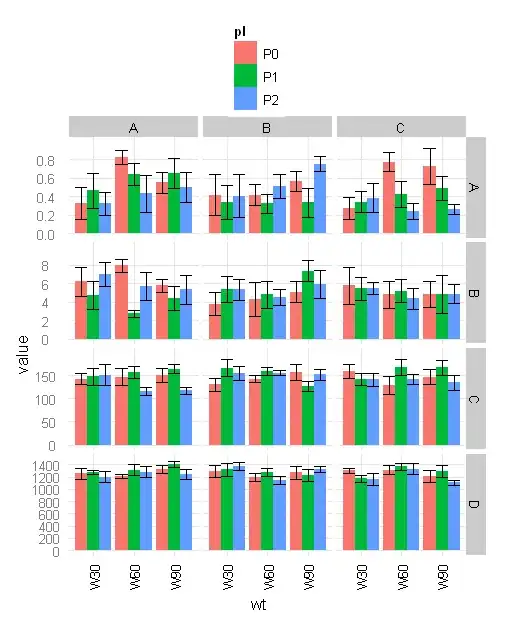
ggplot(dat.m,aes(x=wt,y=value,group=pl,facet=gp,fill=pl))+
stat_summary(fun.y=mean,geom="bar",size=2,position="dodge")+
stat_summary(fun.ymin=function(x)(mean(x)-sd(x)/sqrt(length(x))),geom="errorbar",
fun.ymax=function(x)(mean(x)+sd(x)/sqrt(length(x))),position="dodge")+
facet_grid(variable~facet,scale="free_y")+
opts(legend.position="top")+
scale_colour_manual(values = c("red", "blue", "green"))
Normally, in other library, I tested the data, and pass the label to the text plot, but is it possible to do it in ggplot? eg., in stat_summary(), that use the LSD.test within fun.y?