In interactive mode, the x2tics are disappearing soon when zooming in.
This example was shown here
set tics nomirror
set x2tics
set link x2 via x**2 inv sqrt(x)
plot sin(x)
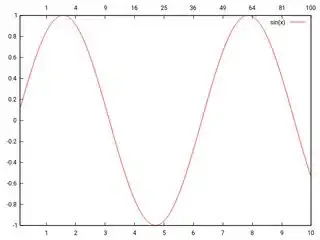
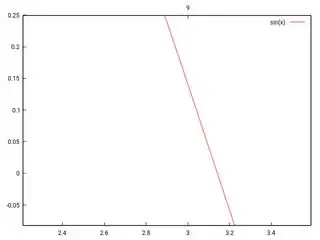
I would like to have at least an orientation, and don't care whether the x2tics are placed equidistant or mapped from the xtics.
A manual set x2tics 1 gives a nice static results.
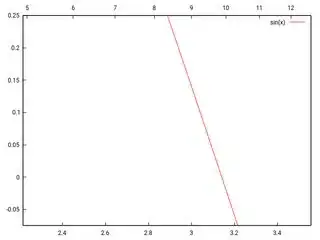
But is there a solution for interactive mode?
Edit:
This clumpy possibility requires to press 'a' to update the plot each time:
bind a "set x2tics (GPVAL_X2_MAX-GPVAL_X2_MIN)/5; replot"
or for a bit more round steps (1,2,5)
bind a "dx2 = (GPVAL_X2_MAX-GPVAL_X2_MIN) / 5;\
        i10 = 10 ** floor(log10(dx2));\
        f10 = dx2 / i10;\
        set x2tics i10*(f10<1.5?1:f10<4?2:5);\
        replot"