29

I have a R dataframe (df), which I am plotting as a bar graph in ggplot2 and coloring based on a column in the dataframe (df$type). Right now, I am using the default coloring pattern (scale_fill_brewer) to assign colors.

How can I assign the color black to one value, (df$type == -1) and use scale_fill_brewer to assign the rest of the colors? (all other df$types are a within a set of integers from 1 to X, where X is the number of unique values)

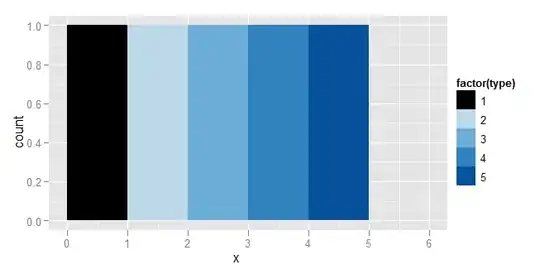
So far, I have been able to do this manually by figuring out the set of colors scale_fill_brewer uses for N different items then predending the color black and passing that to scale_fill_manual.

rhg_cols1<- c("#000000","#F8766D","#7CAE00","#00BFC4","#C77CFF" )
ggplot(y=values,data=df, aes(x=name, fill=factor(type))) + 
  geom_bar()+ scale_fill_manual(values = rhg_cols1)

The problem is that I need a solution that works without manually assigning colors by using a hex color calculator to figuring out the hex values of scale_fill_brewer.

something like:

ggplot(y=values,data=df, aes(x=name, fill=factor(type))) +
  geom_bar()+ scale_fill_brewer(value(-1, "black")

Thank you!

EDIT: The solution must work for more than 30 colors and work for "Set2" of ColorBrewer

AndrewGB
  • 16,126
  • 5
  • 18
  • 49
wespiserA
  • 3,131
  • 5
  • 28
  • 36
  • 1
    I was just wondering about the same. It would be great if `scale_fill_manual()` and others would accept an incomplete vector of specs, e.g. `scale_fill_manual(values=c('-1'='black'))` and understand that the other colors are to be picked automatically as usual. – Pierre D Feb 14 '13 at 00:44

2 Answers2

47

The package RColorBrewer contains the palettes and you can use the function brewer.pal to return a colour palette of your choice.

For example, a sequential blue palette of 5 colours:

library(RColorBrewer)
my.cols <- brewer.pal(5, "Blues")
my.cols

[1] "#EFF3FF" "#BDD7E7" "#6BAED6" "#3182BD" "#08519C"

You can get a list of valid palette names in the ?brewer.pal help files. These names correspond with the names at the ColorBrewer website.

You can now use or modify the results and pass these to ggplot using the scale_manual_fill as you suggested:

my.cols[1] <- "#000000"

library(ggplot2)
df <- data.frame(x=1:5, type=1:5)
ggplot(df, aes(x=x, fill=factor(type))) +
    geom_bar(binwidth=1)+ 
    scale_fill_manual(values = my.cols)

enter image description here

Andrie
  • 176,377
  • 47
  • 447
  • 496
  • Thank for your the very detailed response. Unfortunately Set2 only returns 8 colors, and in some situations I have more than that. – wespiserA May 20 '11 at 18:47
  • Yes, as far as I know almost all of the ColorBrewer palettes have an upper limit of 8 colours. You could also try `scale_fill_hue`. – Andrie May 20 '11 at 18:53
  • `scale_fill_hue` is even harder to tell the difference between colors than what Im using now. What I might do is get the colors from a couple of different sets, push them all together, prepend black and use that...I'm not sure yet, this is shaping into my weekend project... – wespiserA May 20 '11 at 18:58
22

If you need to distinguish among this many (30+) different categories you probably need to back up and spend some more time thinking about the project strategically: it will be nearly impossible to come up with a set of 30 colo(u)rs that are actually distinguishable (especially in a way that is independent of platform/rendering channel).

There is basically no solution that will work with Set2 and 30+ colours. Some of the CB palettes (Set3 and Paired; library(RColorBrewer); display.brewer.all(n=12)) allow as many as 12 colours.

edit: the OP wants to do exploratory data analysis with good, distinguishable colours that won't break if there happen to be a lot of categories. I would suggest something along these lines:

library(RColorBrewer)
my.cols <- function(n) {
  black <- "#000000"
  if (n <= 9) {
    c(black,brewer.pal(n-1, "Set2"))
  } else {
    c(black,hcl(h=seq(0,(n-2)/(n-1),
                  length=n-1)*360,c=100,l=65,fixup=TRUE))
  }
}

library(ggplot2)
d <- data.frame(z=1:10)
g1 <- qplot(z,z,data=d,colour=factor(z))+opts(legend.position="none")
g1 + scale_colour_manual(values=my.cols(9))
g1 + scale_colour_manual(values=my.cols(10))
## check that we successfully recreated ggplot2 internals
## g1+scale_colour_discrete()

I think this works reasonably well (you could substitute Set3 and a cutoff of 13 colours if you preferred). The only drawback (that I can think of) is the discontinuity between the plots with 9 and 10 colours.

Coming up with a better solution for picking sets of N distinguishable colours in a programmatic way is going to be pretty hard ...

Ben Bolker
  • 211,554
  • 25
  • 370
  • 453
  • 2
    A more interesting/challenging solution would be to find a set of points that all fall within the HCL wedge at luminance=65 and are as evenly spaced/far apart as possible. Not trivial ... – Ben Bolker May 20 '11 at 20:10
  • 1
    Following up on @Ben's comment above, `rainbow_hcl` in the **colorspace** package makes it easy to construct pallettes of evenly spaced HCL colors. For example: `library(colorspace); plot(1:10, col=rainbow_hcl(n=10, c=100, l=65), pch=16, cex=6)`. – Josh O'Brien Mar 16 '13 at 01:08
  • 2
    http://tools.medialab.sciences-po.fr/iwanthue/ is a great implementation of my offhand comment above. I think `rainbow_hcl`, like ggplot's colour scheme, gives equally spaced values *around the edges* of an appropriate colour space ... good, but not absolutely what I had in mind, which is to *fill* the color space with evenly spaced points – Ben Bolker Mar 16 '13 at 01:08
  • This is not really an answer to the question. This is re-assigning the entire color scale, which may or may not be the same as the scale used in the current graphic `g1`, before the `scale_*_manual` layer(s) were added. Above is certainly a helpful example, but is there any way to grab the current color scale, modify that as needed (one color, as in the question), and then add that layer back? Or some other approach that changes only one element of the current scale without changing the others? – Paul 'Joey' McMurdie Mar 22 '14 at 18:48
  • 1
    A working native R implementation of "i want hue" is https://github.com/johnbaums/hues . There is also rwanthue but this runs javascript in V8 and does not easily install on OSX. – Ido Tamir Nov 30 '16 at 14:45