0

I want to add general labels to facets in ggplot2. My code looks like this:

library(ggplot2)
df <- data.frame(x= 1:100, y= 1:100,
                 sport= rep(c(TRUE, FALSE), each= 50),
                 female= rep(c(TRUE, FALSE)))

ggplot(df, aes(x, y)) +
  geom_point() +
  facet_grid(female ~ sport)

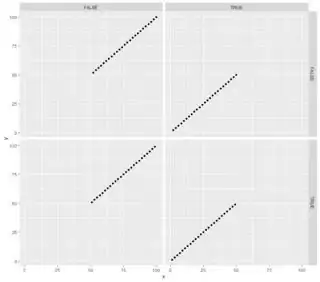
And the plot I get is:

plot

As you can see the labels are not informative at all. How can I add general lebals in facets? Here, it is sport and female.

There is already a similiar question but the answer does not work with the current ggplot2 3.3.0 version.
1 Answers1

0

You'll probably want to use the labeller argument. For your example, manual values will work, but probably assigning functions scales better for your real usecase.

Here is an example of both:

library(ggplot2)

df <- data.frame(x= 1:100, y= 1:100,
                 sport= rep(c(TRUE, FALSE), each= 50),
                 female= rep(c(TRUE, FALSE)))

p1 <- ggplot(df, aes(x, y)) +
  geom_point()

# Using manual values
p1 +
  facet_grid(
    female ~ sport,
    labeller = labeller(
      female = c("TRUE" = "A", "FALSE" = "B"),
      sport = c("TRUE" = "C", "FALSE" = "D")
    )
  )

# Using functions
your_labeller <- labeller(
  female = stringr::str_to_lower,
  sport = stringr::str_to_title
)

p1 +
  facet_grid(
    female ~ sport,
    labeller = your_labeller
  )

Created on 2020-03-24 by the reprex package (v0.2.1)

MSR
  • 2,731
  • 1
  • 14
  • 24
  • I ended up using `p1 + facet_grid(female ~ sport, labeller = labeller(.rows = label_both, .cols = label_both))` which is almoust as I expected.. –  Mar 24 '20 at 12:48