I often have numeric values for faceting. I wish to provide sufficient information to interpret these faceting values in a supplemental title, similar to the axis titles. The labeller options repeat much unnecessary text and are unusable for longer variable titles.
Any suggestions?
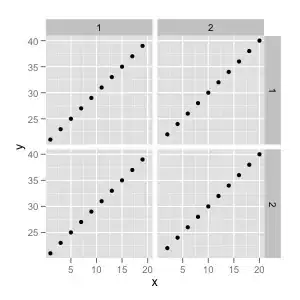
The default:
test<-data.frame(x=1:20, y=21:40, facet.a=rep(c(1,2),10), facet.b=rep(c(1,2), each=20))
qplot(data=test, x=x, y=y, facets=facet.b~facet.a)
What I would love:
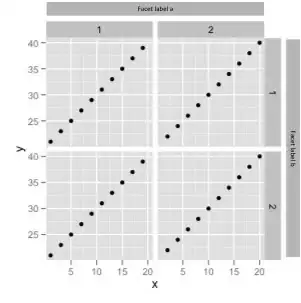
The best I can do in ggplot:
qplot(data=test, x=x, y=y)+facet_grid(facet.b~facet.a, labeller=label_both)
As indicated by @Hendy, similar to: add a secondary y axis to ggplot2 plots - make it perfect