34

I need to make a chart with an optimized y axis maximum value.

The current method I have of making charts simply uses the maximum value of all the graphs, then divides it by ten, and uses that as grid lines. I didn't write it.

Update Note: These graphs have been changed. As soon as I fixed the code, my dynamic graphs started working, making this question nonsensical (because the examples no longer had any errors in them). I've updated these with static images, but some of the answers refrence different values. Keep that in mind. Old Chart 
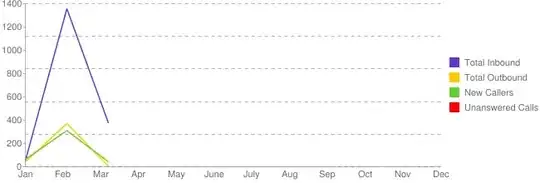
There were between 12003 and 14003 inbound calls so far in February. Informative, but ugly.

I'd like to avoid charts that look like a monkey came up with the y-axis numbers.

Using the Google charts API helps a little bit, but it's still not quite what I want. Google API Chart 
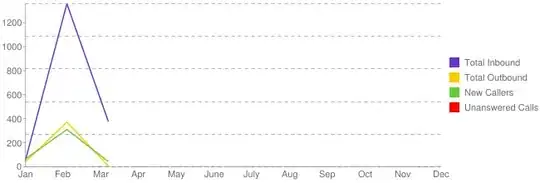
The numbers are clean, but the top of the y value is always the same as the maximum value on the chart. This chart scales from 0 to 1357. I need to have calculated the proper value of 1400, problematically.


I'm throwing in rbobby's defanition of a 'nice' number here because it explains it so well.

  • A "nice" number is one that has 3 or fewer non-zero digits (eg. 1230000)
  • A "nice" number has the same or few non-zero digits than zero digits (eg 1230 is not nice, 1200 is nice)
  • The nicest numbers are ones with multiples of 3 zeros (eg. "1,000", "1,000,000")
  • The second nicest numbers are onces with multples of 3 zeros plus 2 zeros (eg. "1,500,000", "1,200")

Solution

New Chart

I found the way to get the results that I want using a modified version of Mark Ransom's idea.

Fist, Mark Ransom's code determines the optimum spacing between ticks, when given the number of ticks. Sometimes this number ends up being more than twice what the highest value on the chart is, depending on how many grid lines you want.

What I'm doing is I'm running Mark's code with 5, 6, 7, 8, 9, and 10 grid lines (ticks) to find which of those is the lowest. With a value of 23, the height of the chart goes to 25, with a grid line at 5, 10, 15, 20, and 25. With a value of 26, the chart's height is 30, with grid lines at 5, 10, 15, 20, 25, and 30. It has the same spacing between grid lines, but there are more of them.

So here's the steps to just-about copy what Excel does to make charts all fancy.

  1. Temporarily bump up the chart's highest value by about 5% (so that there is always some space between the chart's highest point and the top of the chart area. We want 99.9 to round up to 120)
  2. Find the optimum grid line placement for 5, 6, 7, 8, 9, and 10 grid lines.
  3. Pick out the lowest of those numbers. Remember the number of grid lines it took to get that value.
  4. Now you have the optimum chart height. The lines/bar will never butt up against the top of the chart and you have the optimum number of ticks.

PHP:

function roundUp($maxValue){
    $optiMax = $maxValue * 2;
    for ($i = 5; $i <= 10; $i++){
        $tmpMaxValue = bestTick($maxValue,$i);
        if (($optiMax > $tmpMaxValue) and ($tmpMaxValue > ($maxValue + $maxValue * 0.05))){
            $optiMax = $tmpMaxValue;
            $optiTicks = $i;
        }
    }
    return $optiMax;
}
function bestTick($maxValue, $mostTicks){
    $minimum = $maxValue / $mostTicks;
    $magnitude = pow(10,floor(log($minimum) / log(10)));
    $residual = $minimum / $magnitude;
    if ($residual > 5){
        $tick = 10 * $magnitude;
    } elseif ($residual > 2) {
        $tick = 5 * $magnitude;
    } elseif ($residual > 1){
        $tick = 2 * $magnitude;
    } else {
        $tick = $magnitude;
    }
    return ($tick * $mostTicks);
}

Python:

import math

def BestTick(largest, mostticks):
    minimum = largest / mostticks
    magnitude = 10 ** math.floor(math.log(minimum) / math.log(10))
    residual = minimum / magnitude
    if residual > 5:
        tick = 10 * magnitude
    elif residual > 2:
        tick = 5 * magnitude
    elif residual > 1:
        tick = 2 * magnitude
    else:
        tick = magnitude
    return tick

value = int(input(""))
optMax = value * 2
for i in range(5,11):
    maxValue = BestTick(value,i) * i
    print maxValue
    if (optMax > maxValue) and (maxValue > value  + (value*.05)):
        optMax = maxValue
        optTicks = i
print "\nTest Value: " + str(value + (value * .05)) + "\n\nChart Height: " + str(optMax) + " Ticks: " + str(optTicks)
Grant
  • 11,799
  • 13
  • 42
  • 47

6 Answers6

5

This is from a previous similar question:

Algorithm for "nice" grid line intervals on a graph

I've done this with kind of a brute force method. First, figure out the maximum number of tick marks you can fit into the space. Divide the total range of values by the number of ticks; this is the minimum spacing of the tick. Now calculate the floor of the logarithm base 10 to get the magnitude of the tick, and divide by this value. You should end up with something in the range of 1 to 10. Simply choose the round number greater than or equal to the value and multiply it by the logarithm calculated earlier. This is your final tick spacing.

Example in Python:

import math

def BestTick(largest, mostticks):
    minimum = largest / mostticks
    magnitude = 10 ** math.floor(math.log(minimum) / math.log(10))
    residual = minimum / magnitude
    if residual > 5:
        tick = 10 * magnitude
    elif residual > 2:
        tick = 5 * magnitude
    elif residual > 1:
        tick = 2 * magnitude
    else:
        tick = magnitude
    return tick
Community
  • 1
  • 1
Mark Ransom
  • 299,747
  • 42
  • 398
  • 622
  • I read that question. I thought it was only dealing with the tickmarks between the maxvalue and minimum value? – Grant Mar 04 '09 at 19:25
  • Once you have the spacing between tickmarks, it is trivial to round your endpoints to a multiple of the tickmark. – Mark Ransom Mar 04 '09 at 19:46
  • If I don't have to optimized max value to get the tickmarks from, how is using tickmarks going to help me get the optimized max value? Am I misunderstanding what your tickmark thing does? I don't mean to sound unappreciative, but you're being awfully vague. – Grant Mar 04 '09 at 20:03
  • Yes, I do that sometimes ;) You don't need the optimized max to get the optimized tick size, use the actual max instead. Once that's calculated, the optimized max is ceil(max/tick)*tick. – Mark Ransom Mar 04 '09 at 20:19
  • Thanks for copying the answer from the other thread - I should have done that myself. – Mark Ransom Mar 04 '09 at 22:58
4

You could round up to two significant figures. The following pseudocode should work:

// maxValue is the largest value in your chart
magnitude = floor(log10(maxValue))
base = 10^(magnitude - 1)
chartHeight = ceiling(maxValue / base) * base

For example, if maxValue is 1357, then magnitude is 3 and base is 100. Dividing by 100, rounding up, and multiplying by 100 has the result of rounding up to the next multiple of 100, i.e. rounding up to two significant figures. In this case, the result if 1400 (1357 ⇒ 13.57 ⇒ 14 ⇒ 1400).

Adam Rosenfield
  • 390,455
  • 97
  • 512
  • 589
  • 1357 is rounding to 1360, and 1401 is rounding to 1408. I'll keep checking to see if I've done something wrong here – Grant Mar 04 '09 at 19:18
  • I was doing something wrong. "^" isn't "to the power of" in PHP. This is the closest I've come yet. – Grant Mar 04 '09 at 19:23
  • ^ is bitwise XOR in many languages (I'm not sure about PHP). Try using pow() instead: http://us.php.net/pow – Adam Rosenfield Mar 04 '09 at 20:38
  • Pow(10,x) works. I neglected to mention that I had it working. I meant that your entire answer was the closest I've come yet. – Grant Mar 04 '09 at 20:52
3

In the past I've done this in a brute force-ish sort of way. Here's a chunk of C++ code that works well... but for a hardcoded lower and upper limits (0 and 5000):

int PickYUnits()
{
    int MinSize[8] = {20, 20, 20, 20, 20, 20, 20, 20};
    int ItemsPerUnit[8] = {5, 10, 20, 25, 50, 100, 250, 500};
    int ItemLimits[8] = {20, 50, 100, 250, 500, 1000, 2500, 5000};
    int MaxNumUnits = 8;
    double PixelsPerY;
    int PixelsPerAxis;
    int Units;

    //
    // Figure out the max from the dataset
    //  - Min is always 0 for a bar chart
    //
    m_MinY = 0;
    m_MaxY = -9999999;
    m_TotalY = 0;
    for (int j = 0; j < m_DataPoints.GetSize(); j++) {
        if (m_DataPoints[j].m_y > m_MaxY) {
            m_MaxY = m_DataPoints[j].m_y;
        }

        m_TotalY += m_DataPoints[j].m_y;
    }

    //
    // Give some space at the top
    //
    m_MaxY = m_MaxY + 1;


    //
    // Figure out the size of the range
    //
    double yRange = (m_MaxY - m_MinY);

    //
    // Pick the initial size
    //
    Units = MaxNumUnits;
    for (int k = 0; k < MaxNumUnits; k++)
    {
        if (yRange < ItemLimits[k])
        {
            Units = k;
            break;
        }
    }

    //
    // Adjust it upwards based on the space available
    //
    PixelsPerY = m_rcGraph.Height() / yRange;
    PixelsPerAxis = (int)(PixelsPerY * ItemsPerUnit[Units]);

    while (PixelsPerAxis < MinSize[Units]){
        Units += 1;
        PixelsPerAxis = (int)(PixelsPerY * ItemsPerUnit[Units]);
        if (Units == 5)
            break;
    }


    return ItemsPerUnit[Units];
}

However something in what you've said tweaked me. To pick nice axis numbers a definition of "nice number" would help:

  • A "nice" number is one that has 3 or fewer non-zero digits (eg. 1230000)
  • A "nice" number has the same or few non-zero digits than zero digits (eg 1230 is not nice, 1200 is nice)
  • The nicest numbers are ones with multiples of 3 zeros (eg. "1,000", "1,000,000")
  • The second nicest numbers are onces with multples of 3 zeros plus 2 zeros (eg. "1,500,000", "1,200")

Not sure if the above definition is "right" or actually helpful (but with the definition in hand it then becomes a simpler task to devise an algorithm).

user53794
  • 3,800
  • 2
  • 30
  • 31
  • I like your definition of a 'nice' number. These rules give me something tangible to shoot for. – Grant Mar 04 '09 at 19:11
  • This is similar to the solution that evolved from one of my own questions. It seems that a mostly brute-force method is the way to go: http://stackoverflow.com/questions/302406/algorithm-to-determine-the-usual-cash-payment-amounts-for-a-given-price – e.James Mar 04 '09 at 22:42
3

A slight refinement and tested... (works for fractions of units and not just integers)

public void testNumbers() {
        double test = 0.20000;

        double multiple = 1;
        int scale = 0;
        String[] prefix = new String[]{"", "m", "u", "n"};
        while (Math.log10(test) < 0) {
            multiple = multiple * 1000;
            test = test * 1000;
            scale++;
        }

        double tick;
        double minimum = test / 10;
        double magnitude = 100000000;
        while (minimum <= magnitude){
            magnitude = magnitude / 10;
        }

        double residual = test / (magnitude * 10);
        if (residual > 5) {
            tick = 10 * magnitude;
        } else if (residual > 2) {
            tick = 5 * magnitude;
        } else if (residual > 1) {
            tick = 2 * magnitude;
        } else {
            tick = magnitude;
        }

        double curAmt = 0;

        int ticks = (int) Math.ceil(test / tick);

        for (int ix = 0; ix < ticks; ix++) {
            curAmt += tick;
            BigDecimal bigDecimal = new BigDecimal(curAmt);
            bigDecimal.setScale(2, BigDecimal.ROUND_HALF_UP);
            System.out.println(bigDecimal.stripTrailingZeros().toPlainString() + prefix[scale] + "s");
        }

        System.out.println("Value = " + test + prefix[scale] + "s");
        System.out.println("Tick = " + tick + prefix[scale] + "s");
        System.out.println("Ticks = " + ticks);
        System.out.println("Scale = " +  multiple + " : " + scale);


    }
Craig
  • 31
  • 1
1

If you want 1400 at the top, how about adjusting the last two parameters to 1400 instead of 1357:

alt text

Community
  • 1
  • 1
schnaader
  • 49,103
  • 10
  • 104
  • 136
  • I don't know what the value of the chart will be before hand. I can't manually set all the chart's max values. – Grant Mar 04 '09 at 18:46
  • If you're able to insert the data into the Google Charts API then you have access to the max value going in. – Jeremy L Mar 04 '09 at 18:47
  • The max value in this case is 1357. I know how to round it up to 1400 but a computer might round it up to 1360 or something. – Grant Mar 04 '09 at 18:48
0

You could use div and mod. For example.

Let's say you want your chart to round up by increments of 20 (just to make it more a more arbitrary number than your typical "10" value).

So I would assume that 1, 11, 18 would all round up to 20. But 21, 33, 38 would round to 40.

To come up with the right value do the following:

Where divisor = your rounding increment.

divisor = 20
multiple = maxValue / divisor;  // Do an integer divide here. 
if (maxValue modulus divisor > 0)
   multiple++;

graphMax = multiple * maxValue;

So now let's plugin real numbers:

divisor = 20;
multiple = 33 / 20; (integer divide)
so multiple = 1
if (33 modulus 20 > 0)  (it is.. it equals 13) 
   multiple++;

so multiple = 2;
graphMax = multiple (2) * maxValue (20);
graphMax = 40;
Macon Pegram
  • 256
  • 1
  • 4
  • Wouldn't a number like 1479 round up to 1480 in this case? It's better than what I have currently, but I need it to round up to 1500 when the number is that high. – Grant Mar 04 '09 at 19:03
  • Then make the divisor 100 Here's the math: multiple = 1479 / 100 = 14; if (1479 modulus 100 > 0) (it does... it equals 479) multiple ++; (15) graphMax = multiple (15) * divisor (100) = 1500 – Macon Pegram Mar 04 '09 at 19:15
  • It the formula works for all cases.. you just have to decide what value to want to round to.. round by 20's? Round by 100's. It doesn't matter. – Macon Pegram Mar 04 '09 at 19:16
  • Problem is, I don't know how large the charts are going to be before hand. Some charts are in the 100's, some are in the 10,000's It would be silly to round 5 up to the nearest 1,000. – Grant Mar 04 '09 at 19:26
  • In order to answer this... I'd need to understand your own arbitrary algorithm for determining the rounding point? Let's forget code and formal algorithms for a moment... Given the following MAX values, what would you setup the divisor to?: 138, 597, 1311, 7623, 14921, 81431. – Macon Pegram Mar 04 '09 at 19:39
  • You could base an algorithm off a number of things... An acceptable range of "ticks" or a given amount of precision (say only the first 2 digits of the number) So how would you, if you were just drawing it yourself decide the tick increment? – Macon Pegram Mar 04 '09 at 19:42
  • If I were just to throw out what I think, and try to get the computer to do the same, I'd say, 200, 600, 1500, 8000, 15000, 90000. I'm just going on instinct here. If an algorithm returned 200, 700, 1400... that would be fine in my book. – Grant Mar 04 '09 at 19:49
  • There's probably a name for what I'm trying to accomplish, but I don't know what it is. – Grant Mar 04 '09 at 19:49
  • 1
    Even better, Excel automatically adjusts charts in *just* the way I like. So in simplest terms, I want to copy whatever excel does to calculate scale. – Grant Mar 04 '09 at 20:12