This is a followup to my previous post here
I've a 2D geometry created using the following code, ref.
(defun graph ( pts sls tls )

    (   (lambda ( l )
            (foreach x l (text (cdr x) (itoa (car x)) 0.0 1))
            (mapcar
               '(lambda ( a b / p q r )
                    (setq p (cdr (assoc a l))
                          q (cdr (assoc b l))
                          r (angle p q)
                    )
                    (entmake (list '(0 . "LINE") (cons 10 p) (cons 11 q) '(62 . 8)))
                    (text
                        (mapcar '(lambda ( x y ) (/ (+ x y) 2.0)) p q)
                        (roundupto (distance p q) 12.4)
                        (if (and (< (* pi 0.5) r) (<= r (* pi 1.5))) (+ r pi) r)
                        2
                    )
                )
                sls tls
            )
        )
        (mapcar 'cons (vl-sort (append sls tls) '<) pts)
    )
)
(defun text ( p s a c )
    (entmake
        (list
           '(0 . "TEXT")
            (cons 10 p)
            (cons 11 p)
            (cons 50 a)
            (cons 01 s)
            (cons 62 c)
           '(40 . 2)
           '(72 . 1)
           '(73 . 2)
        )
    )
)

(defun roundupto ( x m / d r )
    (setq d (getvar 'dimzin))
    (setvar 'dimzin 8)
    (setq r (rtos (* m (fix (+ 1 -1e-8 (/ x (float m))))) 2 8))
    (setvar 'dimzin d)
    r
)
Input:
(graph
   '((75 25) (115 45) (90 60) (10 5) (45 0) (45 55) (0 25) (10 50) (115 25))
   '(1 1 1 2 2 3 4 4 6 7 2)
   '(2 4 5 3 6 6 5 7 7 8 9)
)
Output:
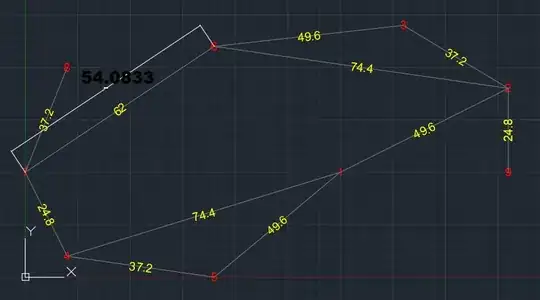
The actual dimensions don't match the value displayed in the text (in yellow) over the lines.
For instance, 62 is the value displayed and 54.0833 is the actual dimension. And I want to rescale the actual lengths to the values displayed, in yellow, over the lines.
I understand the coordinates displayed in the input provided above have to be varied. Probably, the first coordinate can be fixed and the subsequent coordinates can be shifted.
Any suggestions on how to do this will be really helpful.
EDIT: The solution provided here in an answer to my previous post Scaling lengths in an AutoCAD diagram scales only the dimension displayed in yellow using the output obtained from roundupto function. The purpose behind posting this question is to ask for suggestions for scaling the actual lengths and not just the dimensions displayed in yellow.
EDIT2: Adding additional details
If one directly loads the input file in AutoCAD, the yellow text displayed in the following image is the actual dimensions

And I want to convert the dimensions to the corresponding yellow labels displayed in the following image:

Note: The labels displayed in the second image in EDIT2 were altered externally using an AutoLISP code to merely show how the actual lengths of the corresponding lines have to be scaled. In the first image displayed in EDIT2, the edge labels exactly match the lengths of the corresponding lines.
