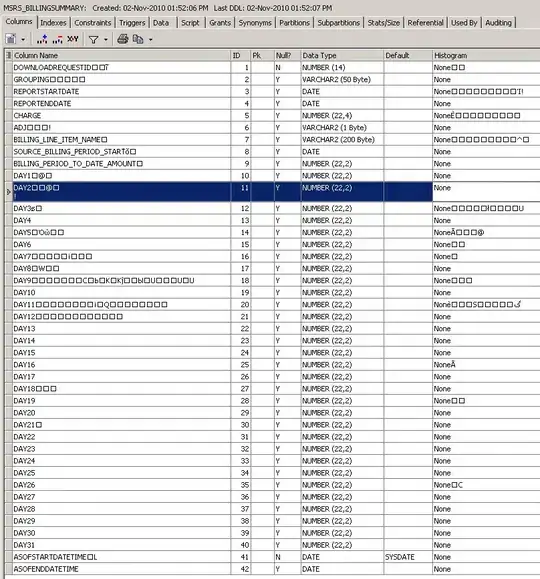
In order to find quickly the location of my data, I display a table with my variables names as well as informations about each.
Since I have a lot of columns (variable) I copy and paste blocks of it in a cell to have them all on 1 screen.
I would like to code this, such that I would input several range of Rows to be extracted and efficiently displayed some how on a Grid that would fit an area of the screen ? I have failed yet to display 2 grid nicely together.
In case I did not express my problem properly above, here is a simple example:
How can I move the blue part to the side of the pink one if the output of laList is what we have to deal with ?
co1    = Range[6];
co2    = Range[11, 16];
co3    = {"A", "B", "C", "D", "E", "F"};

laList = Join[{co1}, {co2}, {co3}] // Transpose;

laListGraph = Grid[laList,
Dividers -> All,
Alignment -> {Left, Center},
ItemSize -> Automatic,
ItemStyle -> Directive[FontSize -> 14, Black, Italic, Bold],
Spacings -> {2, 1},
 Background -> {None, None, {
     {{1, 3}, {1, 3}} -> LightRed,
     {{4, 6}, {1, 3}} -> LightBlue
   } } ]