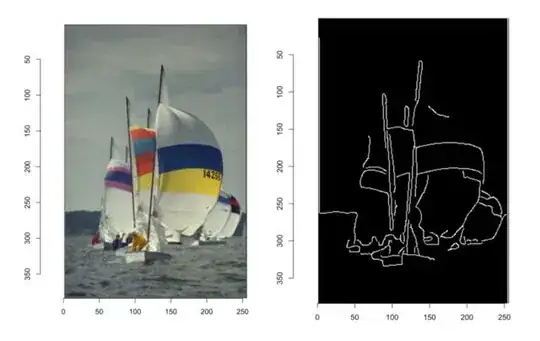
It's possible to identify the edges of an image like so:
library('ggplot2')
library('imager')

plot(boats)
img <- cannyEdges(boats)
plot(img)
But suppose instead of the 'boats' object, we want to do the same thing to an svg (giraffe as an example below), how can we find the edges of the svg image?
I tried the obvious:
library(magick)
giraffe <- image_read_svg("http://steveharoz.com/research/isotype/icons/giraffe.svg")

plot(giraffe)
gimg <- cannyEdges(giraffe)
# Error in if (has.col) { : argument is of length zero
Note
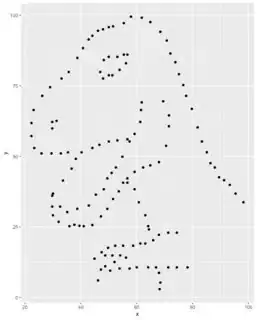
What I'm ultimately trying to do is automatically convert an image of svg format (like the giraffe) into a set of cartesian coordinates for scatterplotting in a geom_point(), like so:
library(datasauRus)
library(ggplot2)

datasaurus_dozen %>%
  filter(dataset == "dino") %>%
  ggplot(aes(x=x, y=y))+
  geom_point()
The ultimate goal is the get the giraffe into a geom_point() like the dinosaur above


