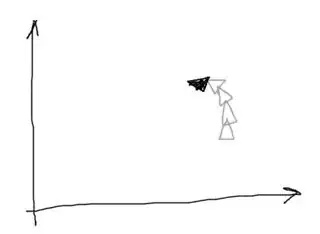
Is it somehow possible to plot a custom marker (like this) interactively, but have it turn in real-time? It seems that the scatter graph does not grant any access to the markers.
Asked
Active
Viewed 219 times
2 Answers
1
You can create a custom marker with a FancyArrowPatch. Many styles and options are possible. Such a patch is not easy to update, but you could just remove the patch and create it again to create an animation.
The easiest way to create an animation is via plt.pause(), but that doesn't work in all environments. Another way is via FuncAnimation, which involves a few more lines, but makes controlling the animation easier.
Here is some example code to show the concepts:
import matplotlib.pyplot as plt
from matplotlib import patches
from matplotlib.collections import PatchCollection
from matplotlib import animation
import numpy as np

fig, ax = plt.subplots()

N = 50
x = np.random.uniform(-20, 20, (N, 2))
dx = np.random.uniform(-1, 1, (N, 2))
dx /= np.linalg.norm(dx, axis=1, keepdims=True)
colors = plt.cm.magma(np.random.uniform(0, 1, N))

arrow_style = "Simple,head_length=2,head_width=3,tail_width=1"

ax.set_xlim(-40, 40)
ax.set_ylim(-30, 30)
ax.set_aspect('equal')

old_arrows = None

def animate(i):
    global old_arrows, x, dx

    if old_arrows is not None:
        old_arrows.remove()
    x += dx
    dx += np.random.uniform(-.1, .1, (N, 2))
    dx /= np.linalg.norm(dx, axis=1, keepdims=True)
    arrows = [patches.FancyArrowPatch((xi, yi), (xi + dxi * 10, yi + dyi * 10), arrowstyle=arrow_style)
              for (xi, yi), (dxi, dyi) in zip(x, dx)]
    old_arrows = ax.add_collection(PatchCollection(arrows, facecolors=colors))
    return old_arrows,

ani = animation.FuncAnimation(fig, animate, np.arange(1, 200),
                              interval=25, repeat=False, blit=True)
plt.show()
JohanC
- 71,591
- 8
- 33
- 66
-
But it's not even animated – Rubi Shnol May 06 '20 at 21:42
-
Yes, I did. It shows static picture that changes each time you start the script – Rubi Shnol May 06 '20 at 21:50
-
When I run it in my interactive environment (pycharm), plt.pause shows an animation. I'll change the code to using FuncAnimation – JohanC May 06 '20 at 21:56
-
I don't think FuncAnimation will fit me. I try to have interactive output from *integrate*. So far, terrible experience compared to MATLAB. As unclear as it can be – Rubi Shnol May 06 '20 at 21:59
-
They don't work differently, they simply don't work or don't work as they are promised to. Integrate is from scipy to solve ODEs.I get new data at each iteration and need to update the graph with a marker. – Rubi Shnol May 07 '20 at 07:38
-
Did you look at this [double pendulum example](https://matplotlib.org/2.0.2/examples/animation/double_pendulum_animated.html)? Does it work for you? Are your functions much more complicated? Certainly there are situations where – JohanC May 07 '20 at 10:09
1
I solved it by remove() and static variables like this:
class pltMarker:
    def __init__(self, angle=None, pathString=None):
        self.angle = angle or []
        self.pathString = pathString or """simply make and svg, open in a text editor and copy the path XML string in here"""
        self.path = parse_path( self.pathString )
        self.path.vertices -= self.path.vertices.mean( axis=0 )
        self.marker = mpl.markers.MarkerStyle( marker=self.path )
        self.marker._transform = self.marker.get_transform().rotate_deg(angle)

    def rotate(self, angle=0):
        self.marker._transform = self.marker.get_transform().rotate_deg(angle)

def animate(k):

    angle = ... # new angle
    myPltMarker.rotate(angle)

    animate.Scatter.remove()
    animate.Scatter = plt.scatter(1, 0, marker=myPltMarker.marker, s=100)

    return animate.Scatter,

angle = ...
myPltMarker = pltMarker(angle=angle)
animatePlt.Scatter = plt.scatter(1, 0, marker=myPltMarker.marker, s=100)

anm = animation.FuncAnimation(fig, animate, blit=False, interval=1)
plt.show()
Rubi Shnol
- 172
- 9

