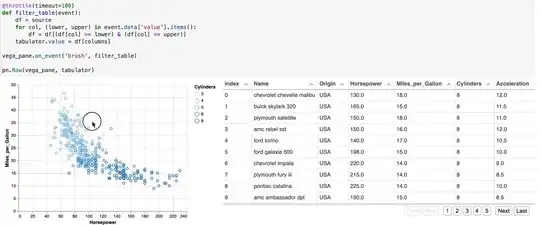
I have a Streamlit dashboard which lets me interactively explore a t-SNE embedding using an Altair plot. I am trying to figure out how to access the metadata of the selected datum so that I can visualize the corresponding image. In other words, given:
selector = alt.selection_single()
chart = (
    alt.Chart(df)
    .mark_circle()
    .encode(x="tSNE_dim1", y="tSNE_dim2", color="predicted class", tooltip=["image url", "predicted class"])
    .add_selection(selector)
)
...is there something akin to
selected_metadata = selector.tooltip
update_dashboard_img(img=selected_metadata["image url"], caption=selected_metadata["predicted class"])
I am aware about image marks but the images are on S3 and there are too many of them to fit in the plot.
