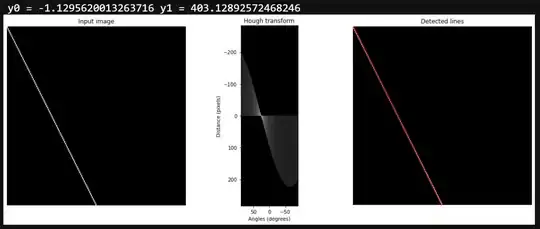
I need help to get the real "start" and "end" points where a line is drawn in the image matrix. In the example below, a detected line is shown using y0 and y1.
import numpy as np

from skimage.transform import hough_line, hough_line_peaks
from skimage.feature import canny
from skimage import data

import matplotlib.pyplot as plt
from matplotlib import cm


# Constructing test image
image = np.zeros((200, 200))
idx = np.arange(0, 200)
image[idx, idx//2] = 255

imgOriginal = image.copy()

# Classic straight-line Hough transform
# Set a precision of 0.5 degree.
tested_angles = np.linspace(-np.pi / 2, np.pi / 2, 360)
h, theta, d = hough_line(image, theta=tested_angles)

# Generating figure 1
fig, axes = plt.subplots(1, 3, figsize=(15, 6))
ax = axes.ravel()

ax[0].imshow(image, cmap=cm.gray)
ax[0].set_title('Input image')
ax[0].set_axis_off()
ax[1].imshow(np.log(1 + h),
             extent=[np.rad2deg(theta[-1]), np.rad2deg(theta[0]), d[-1], d[0]],
             cmap=cm.gray, aspect=1/1.5)
ax[1].set_title('Hough transform')
ax[1].set_xlabel('Angles (degrees)')
ax[1].set_ylabel('Distance (pixels)')
ax[1].axis('image')

ax[2].imshow(image, cmap=cm.gray)
origin = np.array((0, image.shape[1]))
for _, angle, dist in zip(*hough_line_peaks(h, theta, d)):
    y0, y1 = (dist - origin * np.cos(angle)) / np.sin(angle)
    print('y0 = {} y1 = {}'.format(y0, y1))
    ax[2].plot(origin, (y0, y1), '-r')
ax[2].set_xlim(origin)
ax[2].set_ylim((image.shape[0], 0))
ax[2].set_axis_off()
ax[2].set_title('Detected lines')

plt.tight_layout()
plt.show()
This code results in:
What I want is to get the following points in the real image matrix:
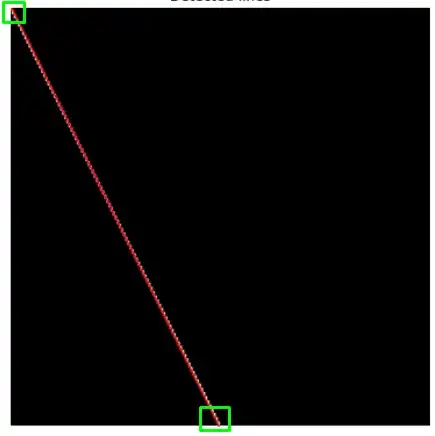
Which is likely to be (0,0) and (199, 100)
In summary, I want to transform y0 and y1 into real points in my numpy matrix.