16

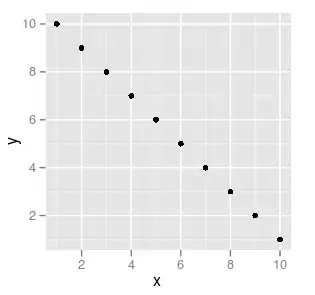
Here is a ggplot from the ggplot wiki:

baseplot <- ggplot(data.frame(x=1:10, y=10:1)) +
    geom_point(aes(x = x, y = y))
baseplot

enter image description here

Question

Is it possible to control these axes separately, e.g. to make only the x-axis black? It does not appear that axis.line.x and axis.line.y are among the options.

What I have tried

  1. The wiki demonstrates that, e.g., it is possible to control the color of the axis

    baseplot + opts(axis.line = theme_segment(colour = 'black', size = 2))
    

    enter image description here

  2. using geom_segment works but has the limitation that the lines have to be matched to the plot numbers.

    Is there a way to get, e.g. the axis max and min and ticks from the baseplot object? That would reduce potential bugs. update the answer to this question, "no, not yet", was covered previously.

    baseplot + geom_segment(aes(x = c(0,0), y = c(0,0), 
                            yend = c(0, max(y)), xend = c(max(x), 0), 
                            size = c(0.5, 0.1))) + 
               geom_segment(aes(x = 0, y = y, 
                            xend = -1, 
                            yend = y, 
                            size = 0.1))
    

enter image description here

Community
  • 1
  • 1
David LeBauer
  • 31,011
  • 31
  • 115
  • 189

4 Answers4

10

It is not supported to control axis line separately. You can remove or edit the line after drawing:

> baseplot + opts(axis.line = theme_segment(colour = 'black', size = 2))
> grid.remove(gPath("axis_v", "axis.line.segments"), grep=TRUE)

> baseplot + opts(axis.line = theme_segment(colour = 'black', size = 2))
> grid.edit(gPath("axis_v", "axis.line.segments"), grep=TRUE, gp=gpar(col="red"))
> grid.edit(gPath("axis_h", "axis.line.segments"), grep=TRUE, gp=gpar(col="blue"))

UPDATED

In 0.9.1-, this may change like:

grid.edit(gPath("axis-l", "axis.line.segments"), grep=TRUE, gp=gpar(col="red"))
grid.edit(gPath("axis-b", "axis.line.segments"), grep=TRUE, gp=gpar(col="blue"))
kohske
  • 65,572
  • 8
  • 165
  • 155
  • @kohske that works very nicely, but is there a way that I can assign the new graph to an object? e.g., so that I can just call `baseplot` and it will plot the edited plot? – David LeBauer Jul 01 '11 at 16:39
  • @kohske I cannot get this to work in ggplot 0.9.0. Has there been a change between the ggplot2 versions? – Misha Jul 09 '12 at 18:51
  • @Misha in 0.9.1? Here is the slight modification. see update. – kohske Jul 09 '12 at 22:50
  • @kohske That worked wonders. Thx a million. If I could somehow accept your answer I would. – Misha Jul 10 '12 at 09:47
3

It seems you can also achieve it easily by adapting a theme thusly:

mytheme <- theme_classic()
mytheme$axis.line.x <- mytheme$axis.line.y <- mytheme$axis.line
mytheme$axis.line.x$colour <- 'red'
ggplot(iris, aes(Sepal.Length, Sepal.Width)) + geom_point() + mytheme

enter image description here

geotheory
  • 22,624
  • 29
  • 119
  • 196
3

I suspect you are correct in your analysis.

However, there is one other potential workaround: geom_hline and geom_vline:

baseplot + 
    geom_hline(yintercept=0, colour="red", size = 3) +
    geom_vline(xintercept=0, colour="blue", size = 2) 

Again not ideal, since the lines span the entire plot area rather than just framing the axis, if you know what I mean.

enter image description here

Andrie
  • 176,377
  • 47
  • 447
  • 496
2

This issue points out that you can turn on both lines and then turn off one of them: https://github.com/hadley/ggplot2/issues/778. I found this strategy to be both simple and effective.

fredtal
  • 571
  • 4
  • 16
  • I don't think that is correct. The issue you link to seems to be a request for such a feature / identification of the expected behavior that you suggest. However, the issue was closed and there are no plans for this behavior to be implemented. – David LeBauer Dec 17 '14 at 18:58