70

UPDATE: Here's a jsfiddle that shows the problem: http://jsfiddle.net/pynju/1/

Click on the blue column on Monday. When the detail-view loads, notice that 01-07 have 3 columns (expected 2). Click on the tallest bar to go back to the original view. Notice that the labels on the xAxis aren't being removed.

===============

I have a bar chart that has 2 series, displayed as pairs of bars, side by side.

series: [{
         showInLegend: false,
         data: dowChartData
      },{
         showInLegend: false,
         data: avgUserDowChartData
      }],

.

dowChartData = [                                                                                                                                                                                                                                                                                                                                                                                                                                                                                                                                                                                                                                                                                                                                                                                                                                                                                                                                                                                                                                                                                                                                                                                                                                                                                                                                                                                                   {
                y: 98.74,
                color: '#0072ff',
                drilldown: {
                   name: 'Category Engagement - Sunday',
                   categories: ['00','01','02','03','04','05','06','07','08','09','10','11','12','13','14','15','16','17','18','19','20','21','22','23'],
                   data: [0,637,0,0,0,173,48.54,48.54,0,0,0,0,0,0,102.24,166.36,706.59,699.18,298.32,184.14,97.08,1539,0,1224.56],
                   color: '#0072ff',
                   data2: [506.80686467275,354.56354558498,333.25158689567,234.19283190879,234.82132336088,220.03247578171,222.86420797556,218.14034615202,170.42559544164,171.54776353196,249.24788461442,345.14915669555,206.65543589797,243.38811965637,367.02593304906,378.83677778129,467.45739743621,424.26264387522,639.60922934374,679.71299714907,373.26353846375,480.94380626458,551.82326068362,466.77469230724],
                   color2: '#C00'
                }
             }
AND SIMILAR

.

avgUserDowChartData = [                                                                                                                                                                                                                                                                                                                                                                                                                                                                                         {
                y: 142.35,
                color: '#C00'
             },
AND SIMILAR

The initial data is day of week data with the X-axis being: Sunday - Monday - Tues - Wed - Thurs - Fri - Saturday

The initial series has a drilldown element with a new data & data2 (see above)

Using the drilldown demo code as an example, I have this code in place:

column: {
              borderWidth: 0,
            cursor: 'pointer',
            point: {
               events: {
                  click: function(event) {
                     var drilldown = this.drilldown;
                     if (drilldown) { // drill down
                        setChart(dowChart, drilldown.name, drilldown.categories, drilldown.data, drilldown.color, drilldown.data2, drilldown.color2);
                     } else { // restore
                        setChart(dowChart, '', dowCategories, dowChartData);
                     }
                  }
               }
            },

Set chart handler:

function setChart(chart, name, categories, data, color, data2, color2) {
      chart.xAxis[0].setCategories(categories);
//      chart.series[0].remove();
      for (var i = 0; i < chart.series.length; i++) {
          chart.series[i].remove();
      }
      chart.addSeries({
         showInLegend: false,
         name: name,
         data: data,
         color: color || 'white'
      });
      if (typeof(data2) != undefined && data2.length > 0) {
          chart.addSeries({
             showInLegend: false,
             name: name,
             data: data2,
             color: color2 || 'white'
          });
      }
   }

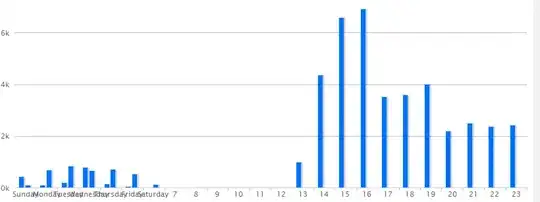
The initial chart display perfectly fine: initial display

When you click on any of the blue bars (the data set that has the drilldown), things get wonky for the first 7 x-axis items: drill down - broken display

It's as if the initial data sets aren't being removed by the code:

for (var i = 0; i < chart.series.length; i++) {
          chart.series[i].remove();
      }

When you click on any of the bars with the intention of resetting to the original data set/series: reset data to original set - broken display

So... it's clear that the remove series code I'm using isn't working. What's the best way to completely remove the data on the chart and the 2 series I need to display each time depending on what is clicked?

Z Jones
  • 2,015
  • 4
  • 23
  • 42

8 Answers8

153

Try this to remove all chart series,

while(chart.series.length > 0)
    chart.series[0].remove(true);

it works for me. the code

for (var i = 0; i < chart.series.length; i++)

won't work because the chart.series.length is decreased each time remove() is called. That way, the i will never reach the expected length.

starball
  • 20,030
  • 7
  • 43
  • 238
Lee
  • 3,259
  • 4
  • 21
  • 27
  • 3
    Your while loop could accidentally get an auto-inserted semi-colon on the while loop. You should make it all one line or use braces. – mkmurray Jan 09 '12 at 21:35
  • 1
    This totally worked for me. It's a very insightful solution, what with noticing the change in length. Thank you! – thekingoftruth Mar 20 '12 at 05:28
  • 1
    You're correct in saying the for loop you listed "for (var i = 0; i < chart.series.length; i++) won't work because the chart.series.length is decreased each time...", but you can simply start from the end of the series: for(var i = chart.series.length - 1; i > -1; i--). I like this route because StockCharts uses the first or second series as the navigator and I can update that series while keeping all of the "Navigator" attributes attached to it. See my answer below. – Scott May 13 '14 at 20:41
  • I've been stuck with this issue for 3 days. THANKS A LOT @Lee ! – Kabulan0lak Jun 17 '15 at 10:23
  • In general when removing from an array one should count down: `var i = arr.length;while(--i>-1){if(true){arr.splice(i,1)}}` Works all the time even if one just wants to remove some of the data from the array. – HMR Mar 29 '16 at 05:19
  • I had to use chart.highcharts() instead of chart. Where I initialised it like this: chart = $('#line-chart').highcharts({ blabla }); – Melvin May 07 '16 at 17:03
  • While the above answer is correct, the following is the most performant way of removing all series: `var i = chart.series.length; while(i--) { chart.series[i].remove(); }` – shanonvl Jun 13 '16 at 13:56
  • What if series has more than 1 element and you want remove all of them. Which is the case with a multi-layered pie (donut) chart. – Loolooii Nov 28 '16 at 10:42
43

The following way the chart will not redraw every iteration.
So you'll get a better performance.

while( chart.series.length > 0 ) {
    chart.series[0].remove( false );
}

chart.redraw();
Ricardo Alvaro Lohmann
  • 26,031
  • 7
  • 82
  • 82
  • 1
    Read something similar elsewhere, however they used: "while(chart.series.length) chart.series[0].remove(false);" Not a big difference, just four characters, but it works – Steven Rogers Jul 18 '14 at 22:54
  • Thanks! Solved my problem with initing scatter plots (< 2500 points). – sukkis Mar 01 '19 at 19:26
9

Another way to remove all series in HighCharts with a for loop is to start from the end. Here's how to do it:

var seriesLength = chart.series.length;
for(var i = seriesLength - 1; i > -1; i--) {
    chart.series[i].remove();
}

I prefer to go this route because when using a HighStock chart, the navigator is usually the first series. I also prefer to keep a variable set to the navigator series. In that case, I'll do the following:

var seriesLength = chart.series.length;
var navigator;
for(var i = seriesLength - 1; i > -1; i--) {
    if(chart.series[i].name.toLowerCase() == 'navigator') {
        navigator = chart.series[i];
    } else {
        chart.series[i].remove();
    }
}

Now I can easily set the navigator series.

Here's an example of removing all series from a Highchart: http://jsfiddle.net/engemasa/srZU2/

Here's an example of resetting a HighStock chart with new data (including the navigator series): http://jsfiddle.net/engemasa/WcLQc/

Scott
  • 772
  • 1
  • 11
  • 20
  • Thank you ! I was wondering why my navigator was messed up ! (ps: it seems to be Navigator, with a capital N now) – doobdargent Jul 08 '14 at 09:25
  • And it looks like in the newest version of Stock charts the navigator series might not be the first series anymore. But with this method you can still keep track of it and update it accordingly. – Scott Jul 09 '14 at 11:02
1

The reason for (var i = 0; i < chart.series.length; i++) doesn't work is because you're modifying the array while you're looping over it. To get around this, you can iterate over the array from right to left, so when you remove an element, the index of the array will still point to the last item in the array.

Using lodash's forEachRight, you can do:

_.forEachRight(chart.series, chartSeries => {
  chartSeries.remove(false);
});

chart.redraw();
chipit24
  • 6,509
  • 7
  • 47
  • 67
0

var seriesLength = chart.series.length; for(var i = seriesLength -1; i > -1; i--) { chart.series[i].remove(); }

Kirkland
  • 3,257
  • 1
  • 16
  • 17
YASH GAUTAMI
  • 673
  • 1
  • 6
  • 11
0

You can also update and add a new series and if the new series is less than the current series then remove the series:

var hChart = $("#Chart").highcharts();

for (var i = 0; i < newSeries.length; i++) { //UPDATE-OLD/ADD-NEW SERIES
    if (hChart.series[i])
        hChart.series[i].update(newSeries[i]);
    else
        hChart.addSeries(newSeries[i]);
}

var serieslen = newSeries.length;
if (hChart.series[serieslen]) {
    var loopfrm = hChart.series.length - 1;
    for (var i = loopfrm; i >= serieslen; i--) {//REMOVE SERIES
        hChart.series[loopfrm].remove();
    }
}
Elletlar
  • 3,136
  • 7
  • 32
  • 38
0

It may just be a simple matter of telling the chart to redraw. When you remove a series, try forcing the chart to redraw:

for (var i = 0; i < chart.series.length; i++) {
    chart.series[i].remove(true); //forces the chart to redraw
}
NT3RP
  • 15,262
  • 9
  • 61
  • 97
-1

I found the working solution. Try this:

for (var i = 0; i < chart.series.length; i++) {
   chart.series[0].remove();
}
chart.redraw();

It will completely remove all series.

amadi
  • 7
  • 1