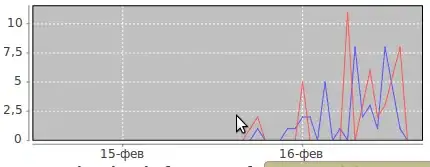
How can I display full thick label? It always gets cut off and replaced by 3 dots. I've been trying various options from https://www.chartjs.org/docs/master/axes/index with padding and similar, but I can't find this. Full date data is there.
Asked
Active
Viewed 438 times
1 Answers
1
You are using a previous version of Charts.js. With Charts.js >2.0 axis label should grow as much as needed to display the full date unless you override the label function like done here.
Demo: https://codepen.io/adelriosantiago/pen/wvooQRR?editors=1010
Date format can be changed in options.scales:
xAxes: [{
  type: "time",
  time: {
    unit: 'hour',
    unitStepSize: 0.5,
    round: 'hour',
    tooltipFormat: "h:mm:ss a",
    displayFormats: {
      hour: 'Y MMMM D, H:M:S A'
    }
 }
}]
adelriosantiago
- 7,762
- 7
- 38
- 71
-
I'm using chart.js 2.9.4. Double checked it. It's installed by Vue component vue-chartkick. I'm still able to use chart.js configuration directly and I have managed to change date format with code you have provided, but is still gets shortened (and unusable). Thanks for the demo, I've learned few new things but this problem remains. – Ibiza Feb 14 '21 at 02:00
-
Then probably the label printing is being overridden by a function. Any chance we can see part of the code? – adelriosantiago Feb 14 '21 at 06:13
-
1My code is very simple, no functions for this, but I have found the source of the problem in npm module https://github.com/ankane/chartkick.js/blob/master/src/adapters/chartjs.js The first line of function let setLabelSize (ln 129) is not calculating well. Function will not truncate label for few dots on x axis, but if I have many dots it will truncate without any need for that. – Ibiza Feb 15 '21 at 19:42

