I am aware of the existence of this, and this on this topic. However, I would like to finalize on an actual implementation in Python this time.
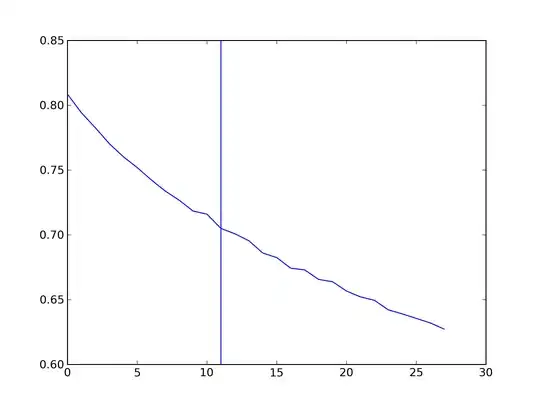
My only problem is that the elbow point seems to be changing from different instantiations of my code. Observe the two plots shown in this post. While they appear to be visually similar, the value of the elbow point changed significantly. Both the curves were generated from an average of 20 different runs. Even then, there is a significant shift in the value of the elbow point. What precautions can I take to make sure that the value falls within a certain bound?
My attempt is shown below:
def elbowPoint(points):
  secondDerivative = collections.defaultdict(lambda:0)
  for i in range(1, len(points) - 1):
    secondDerivative[i] = points[i+1] + points[i-1] - 2*points[i]

  max_index = secondDerivative.values().index(max(secondDerivative.values()))
  elbow_point = max_index + 1
  return elbow_point

points = [0.80881476685027154, 0.79457906121371058, 0.78071124401504677, 0.77110686192601441, 0.76062373158581287, 0.75174963969985187, 0.74356408965979193, 0.73577573557299236, 0.72782434749305047, 0.71952590556748364, 0.71417942487824781, 0.7076502559300516, 0.70089375208028415, 0.69393584640497064, 0.68550490458450741, 0.68494440529025913, 0.67920157634796108, 0.67280267176628761]
max_point = elbowPoint(points)