I have questions about the MS ASP.NET chart control.
- How can a line series be set over a bar series so that it extends to the y-axis of a chart?
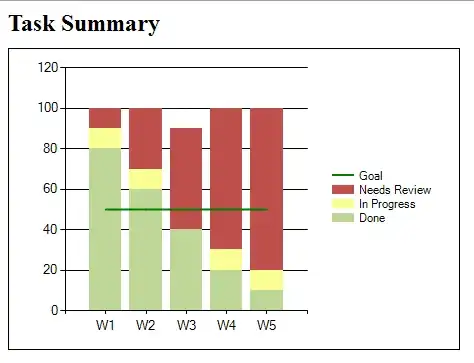
- Is it possible to place the name of the line series, i.e. "Goal", to the right of the chart as a replacement to including this series in the legend?
As you can see in the screenshot below, I have a line series presenting on top of a bar series that doesn't extend to the y-axis of the chart.
The code is as follows:
var data1 = new Dictionary<string, float>
{
    { "W1", 80},
    { "W2", 60},
    { "W3", 40},
    { "W4", 20},
    { "W5", 10}
};
var data2 = new Dictionary<string, float>
{
    { "W1", 10},
    { "W2", 10},
    { "W3", 0},
    { "W4", 10},
    { "W5", 10}
};
var data3 = new Dictionary<string, float>
{
    { "W1", 10},
    { "W2", 30},
    { "W3", 50},
    { "W4", 70},
    { "W5", 80}
};
var data4 = new Dictionary<string, float>
{
    { "W1", 50},
    { "W2", 50},
    { "W3", 50},
    { "W4", 50},
    { "W5", 50}
};

var chart = new Chart();
chart.Height = Unit.Pixel(300);
chart.Width = Unit.Pixel(450);
chart.Legends.Add("Legend").Alignment = StringAlignment.Center;
chart.Palette = ChartColorPalette.None;
chart.PaletteCustomColors = new Color[] { Color.FromArgb(191, 214, 151), Color.FromArgb(249, 255, 149), Color.FromArgb(191, 79, 75), Color.Green };

var area = new ChartArea();
area.AxisX.MajorGrid.LineColor = Color.Transparent;
chart.ChartAreas.Add(area);

var series1 = new Series("Done");
foreach (var item in data1)
{
    series1.Points.AddXY(item.Key, item.Value);
}
series1.MarkerBorderWidth = 1;

var series2 = new Series("In Progress");
foreach (var item in data2)
{
    series2.Points.AddXY(item.Key, item.Value);
}

var series3 = new Series("Needs Review");
foreach (var item in data3)
{
    series3.Points.AddXY(item.Key, item.Value);
}

var series4 = new Series("Goal");
foreach (var item in data4)
{
    series4.Points.AddXY(item.Key, item.Value);
}
series4.ChartType = SeriesChartType.Line;
series4.BorderWidth = 2;

series1.ChartType = series2.ChartType = series3.ChartType = SeriesChartType.StackedColumn;
series1.Font = series2.Font = series3.Font = series4.Font = new Font("Verdana", 8.25f, FontStyle.Regular);

chart.Series.Add(series1);
chart.Series.Add(series2);
chart.Series.Add(series3);
chart.Series.Add(series4);
Thanks for the help.
UPDATE:
As I continue to search for an appropriate solution, I implemented an additional chart for just the "Goal" line series with the intentions of:
- Setting the color of certain properties of this new chart to Transparent and
- Laying this chart on top of the existing chart
This approach provided the correct presentation by displaying the "Goal" line series over the bar series and allowing the "Goal" line series to extend to the y-axis. But it disabled the tooltips and the click actions of the bar series on the existing chart. Due to this deficient user experience, this approach isn't a suitable solution.
The search for a solution continues...