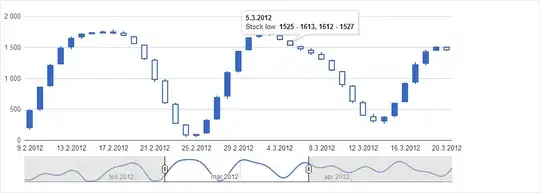
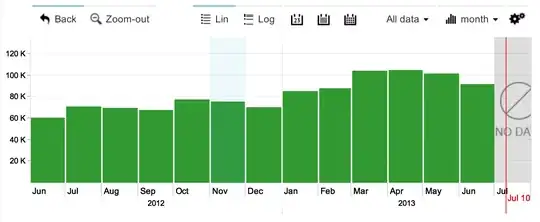
On January 29, 2014 Google has made available a new version of such a chart called Annotation Chart. It's pretty cool indeed! Best of all it's free to user wherever you want.
Annotation charts are interactive time series line charts that support
annotations. Unlike the annotated timeline, which uses Flash,
annotation charts are SVG/VML and should be preferred whenever
possible.
Sample:
<html>
  <head>
    <script type='text/javascript' src='http://www.google.com/jsapi'></script>
    <script type='text/javascript'>
      google.load('visualization', '1.1', {'packages':['annotationchart']});
      google.setOnLoadCallback(drawChart);
      function drawChart() {
        var data = new google.visualization.DataTable();
        data.addColumn('date', 'Date');
        data.addColumn('number', 'Kepler-22b mission');
        data.addColumn('string', 'Kepler title');
        data.addColumn('string', 'Kepler text');
        data.addColumn('number', 'Gliese 163 mission');
        data.addColumn('string', 'Gliese title');
        data.addColumn('string', 'Gliese text');
        data.addRows([
          [new Date(2314, 2, 15), 12400, undefined, undefined,
                                  10645, undefined, undefined],
          [new Date(2314, 2, 16), 24045, 'Lalibertines', 'First encounter',
                                  12374, undefined, undefined],
          [new Date(2314, 2, 17), 35022, 'Lalibertines', 'They are very tall',
                                  15766, 'Gallantors', 'First Encounter'],
          [new Date(2314, 2, 18), 12284, 'Lalibertines', 'Attack on our crew!',
                                  34334, 'Gallantors', 'Statement of shared principles'],
          [new Date(2314, 2, 19), 8476, 'Lalibertines', 'Heavy casualties',
                                  66467, 'Gallantors', 'Mysteries revealed'],
          [new Date(2314, 2, 20), 0, 'Lalibertines', 'All crew lost',
                                  79463, 'Gallantors', 'Omniscience achieved']
        ]);

        var chart = new google.visualization.AnnotationChart(document.getElementById('chart_div'));

        var options = {
          displayAnnotations: true,
        };

        chart.draw(data, options);
      }
    </script>
  </head>

  <body>
    <div id='chart_div' style='width: 900px; height: 500px;'></div>
  </body>
</html>


