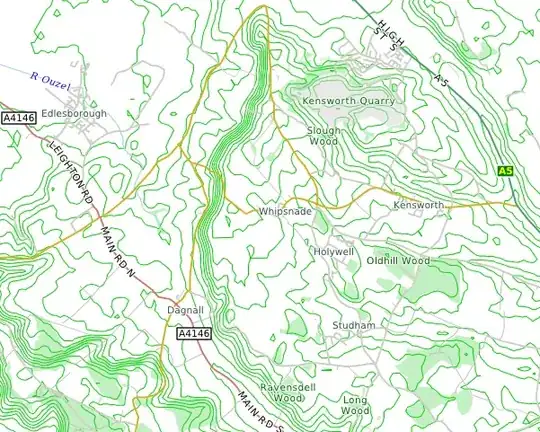
I am currently trying to implement an algorithm to identify whether or not a point is in an ellipse in an image such as the following:
I am using the following algorithm to return a truth value as to whether the point is in the ellipse.
def ellipse_inequality(x, y, x0, y0, a, b, theta):
    lhs = (np.cos(theta)*(x-x0)+np.sin(theta)*(y-y0))**2/a**2
    rhs = (np.sin(theta)*(x-x0)+np.cos(theta)*(y-y0))**2/b**2
    # Returns a truth value.
    return (lhs+rhs) < 1
Which is based around the formula for a rotated ellipse.
If this returns True, then the point is in the ellipse.
The main idea of this is that I am trying to develop an algorithm that can identify if two points are in the same ellipse. Using the following code
# For a given ellipse, this returns a truth value as to whether the point lies in the ellipse.
def is_in_ellipse(point, x0, y0, a, b, theta):
    print(point)
    print(ellipse_inequality(point[0], point[1], x0, y0, a, b, theta))
    return ellipse_inequality(point[0], point[1], x0, y0, a, b, theta)


# This function determines if two points are in the same cluster
def same_cluster(point_1, point_2, csv):
    # for all centroids in the fibers csv...
    for i in range(np.shape(csv)[0]):
        # extract the centroid, minor/major axis length and orientation of each fiber
        x0 = csv.iloc[i]['centroidx']
        y0 = csv.iloc[i]['centroidy']
        a = csv.iloc[i]['major_axis_length']
        b = csv.iloc[i]['minor_axis_length']
        theta = csv.iloc[i]['orientation']
        # Only return True if both points lie in the ellipse.
        if is_in_ellipse(point_1, x0, y0, a, b, theta):
            if is_in_ellipse(point_2, x0, y0, a, b, theta):
                return True
    return False
Where the data regarding the geometry of the ellipse is collected from a csv file. This algorithm is not working, and produces results such as the following:
Any help regarding this would be much appreciated
# For 10 pairs of points, we run the algorithm.
for i in range(10):
    point_1, point_2 = get_line_points(25, width, height)
    # checking if both points are fibers
    is_fibers = same_cluster(point_1, point_2, fibers)
    # if they are both fibers in the same cluster then plot a green line, otherwise plot a red one
    if is_fibers:
        ax.scatter(point_1[0], point_1[1], c='g', s=5)
        ax.scatter(point_2[0], point_2[1], c='g', s=5)
        line_between_points(point_1, point_2, 'g')
    else:
        ax.scatter(point_1[0], point_1[1], c='r', s=5)
        ax.scatter(point_2[0], point_2[1], c='r', s=5)
        line_between_points(point_1, point_2, 'r')