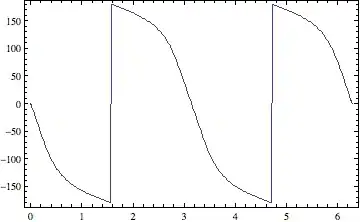
I am trying to fix the Phase plot part of BodePlot, as it does not wrap correctly. And there is no option that I can use to tell it to wrap.
So, instead of doing the full plot myself, (I can do that if I have to) I am thinking of first making the BodePlot, grab the data points, do the wrapping on the data (once I get the x,y data, the rest is easy), then I need to put the new list of points back into the plot, and then use Show to display it.
The part I am stuck at, is extracting the points from FullForm. I can't get the correct Pattern to do that.
This is what I go to so far:
hz=z/(z^2-z+0.3);
tf=TransferFunctionModel[hz,z,SamplingPeriod->2];
phasePlot=BodePlot[tf,{0.001,2 Pi},
       ScalingFunctions->{Automatic,{"Linear","Degree"}},PlotLayout->"List"][[2]]
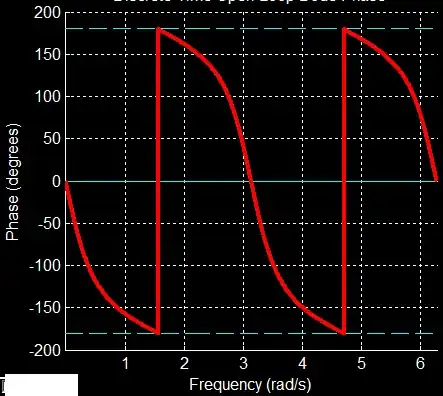
You see how it does not wrap at 180 degrees. It is more common in dsp that Bode phase plot wraps. Here is what it 'should' look like:
So, this is what I did:
 FullForm[phasePlot]
Graphics[List[
  List[List[], List[],
   List[Hue[0.67, 0.6, 0.6],
    Line[List[List[0.0010000243495554542, -0.2673870119911639],
      List[0.0013659538057574799, -0.36521403872250247],
      List[0.0017318832619595053, -0.46304207336414027],
      ....
I see the data there (the x,y) But how to pull them out? I tried this:
Cases[FullForm[phasePlot], List[x_, y_] -> {x, y}, Infinity];
But the above matches in addition to the list of point, other stuff that I do not need. I tried many other things, but can't get only the list of points out.
I was wondering if someone knows how to pull only the (x,y) points from the above plot. Is there a better way to do this other than using FullForm?
Thanks
Update:
I just find a post here which shows how to extract data from plot. So I used it:
points = Cases[Normal@phasePlot, Line[pts_] -> pts, Infinity]