11

I have been going through the examples provided on this page, but for some reason unable to find the right way of doing this.

I have some data like this:

      Group Member Percentage
 [1,] "1"   "A"    "60"      
 [2,] "1"   "A"    "20"      
 [3,] "1"   "A"    "20"      
 [4,] "1"   "B"    "80"      
 [5,] "1"   "B"    "5"       
 [6,] "1"   "B"    "5"       
 [7,] "1"   "B"    "5"       
 [8,] "2"   "C"    "50"      
 [9,] "2"   "C"    "50"      
[10,] "2"   "D"    "25"      
[11,] "2"   "D"    "25"      
[12,] "2"   "D"    "25"      
[13,] "2"   "D"    "20"      
[14,] "2"   "D"    "5"   

and can be created with the following commands:

a = c(1,1,1,1,1,1,1,2,2,2,2,2,2,2)
b = c("A","A","A","B","B","B","B","C","C","D","D","D","D","D")
c = c(60,20,20,80,5,5,5,50,50,25,25,25,20,5)
dat = data.frame(Group=a, Member=b, Percentage=c)
ggplot(dat, aes(x=Member, y=Percentage)) + geom_bar(stat="identity", position="dodge", fill="white", colour="black")

The last line gives me the following plot:
enter image description here

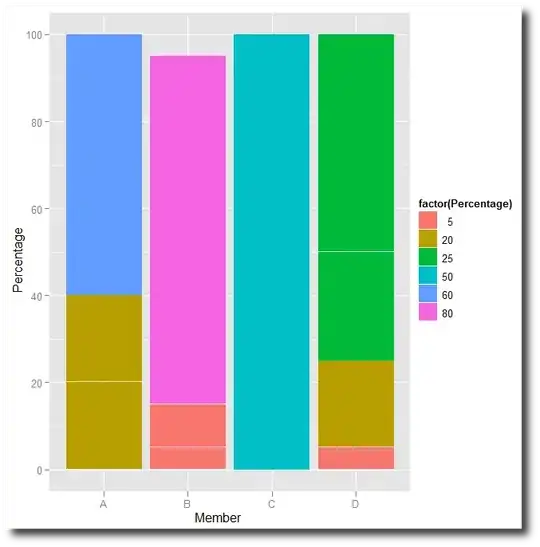
What I am really looking for is to concatenate each of the bars in one group to one single bar and represent the percentages as fraction of the same bar (where each member from each group is plotted with one bar with each bar having the percentages as their colors). So I used the following:

ggplot(dat, aes(x=Member, y=Percentage)) + geom_bar(stat="identity", colour="white")

and obtained this:

enter image description here

But now I can't get the colors properly. I want something exactly like the one give below but I am not able to understand how to do this. Any suggestions on how to do this?


enter image description here

Andrie
  • 176,377
  • 47
  • 447
  • 496
Legend
  • 113,822
  • 119
  • 272
  • 400
  • 1
    http://had.co.nz/ggplot2/position_stack.html – Ari B. Friedman Jul 27 '11 at 21:41
  • @gsk3: Just managed to do it after some experimentation though I did not use `position="stack"`. I wonder what the difference is. What would have been good is to limit ggplot from using limited colors instead of using one for every new percentage it finds. – Legend Jul 27 '11 at 21:44

2 Answers2

11

Ok finally got it! Hurray! Here's the complete code if someone else is interested:

a = c(1,1,1,1,1,1,1,2,2,2,2,2,2,2)
b = c("A","A","A","B","B","B","B","C","C","D","D","D","D","D")
c = c(60,20,20,80,5,5,5,50,50,25,25,25,20,5)
dat = data.frame(Group=a, Member=b, Percentage=c)
ggplot(dat, aes(x=Member, y=Percentage, fill=Percentage)) + geom_bar(stat="identity", colour="white")

enter image description here

and with what was suggested by @joran (Thanks a lot!) in the comments:

ggplot(dat, aes(x=Member, y=Percentage, fill=Percentage)) + geom_bar(stat="identity", colour="white")

enter image description here

Legend
  • 113,822
  • 119
  • 272
  • 400
  • 2
    Well done! I was just about to post this...note that if you want a discrete color scale on Percentage, rather than a continuous one, just use `fill = factor(Percentage)`. – joran Jul 27 '11 at 21:44
  • +1 Oh wonderful! I was looking for this version! I could do away with a better color scheme though. Need to explore more on this. – Legend Jul 27 '11 at 21:46
  • As a slightly unrelated question, would you happen to know how to change that `factor(Percentage)` text on the legend to the right to something else by any chance? – Legend Jul 27 '11 at 21:47
  • 2
    Sure, `+ labs(fill = "Fill label")` – joran Jul 27 '11 at 21:48
5

You're close. Try

ggplot(dat, aes(x=Member, y=Percentage, fill = factor(Percentage))) + geom_bar(stat = "identity")

Which produces

enter image description here

Roman Luštrik
  • 69,533
  • 24
  • 154
  • 197
  • +1 Thank you for this! Just updated my answer with @joran's comments. I guess a little more tweaking and these graphs will look awesome. – Legend Jul 27 '11 at 21:48