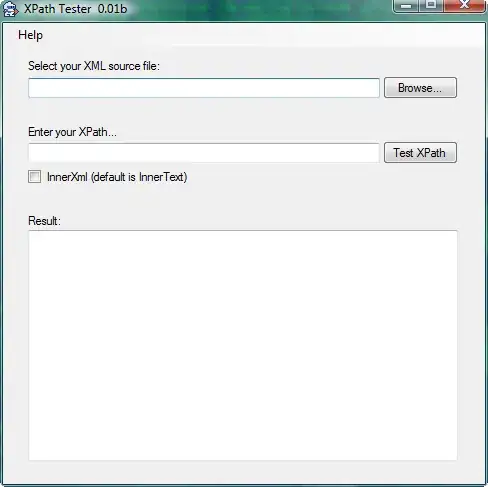
I am new to Tkinter and am working on a GUI based on ML. I want to add a histogram plot from a dataframe into Tkinter and am stuck. This is the histogram plot:
This is part of my code
class Hplot:
    def __init__(self,data,master):
        self.master = master
        self.data = data

        self.window = Toplevel(self.master)
        self.window.title("Histogram Plot")
        self.window.configure(background='white')
        #self.window.resizable(False, False)

        self.figure = Figure(figsize=(5, 5), dpi=100)
        self.sub = self.figure.add_subplot(111)
        self.sub.hist(data,bins=50)
        self.sub.plot()

        self.canvas = FigureCanvasTkAgg(self.figure, master=self.window)
        self.canvas.get_tk_widget().pack()
        #self.canvas.draw()
Pls suggest the correction.
