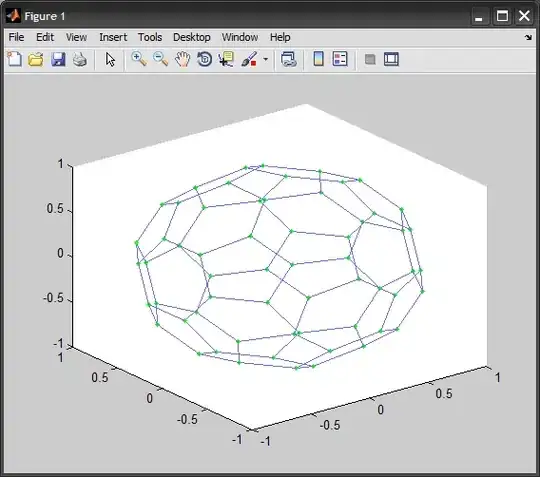
I think you can do something like this (caution - brain compiled code...)
figure;
patch('faces', edges, 'vertices', points, 'edgecolor', 'b');
axis equal;
Where edges should be an Nx2 matrix of indices and points should be an Mx3 matrix of coordinates (the transpose of your points array).
From my experience, calling patch directly can be significantly faster than repeated calls to plot.
To give some idea, the times to generate 1000 randomly generated line segments, using my (admittedly old!) MATLAB 7.1 are as follows:
- Calling
patch: 0.03 seconds.
- Calling
plot: 0.5 seconds.
EDIT: One way to get the edge colour behaving as you want (specifying a single colour per edge) is to introduce duplicate vertices as follows:
This works-around the issue that the edge colour can only be specified indirectly via vertex colour data. If we were to rely only on the vertex colours then all edges sharing a common vertex might end up with the colour assigned to that vertex - check out the 'flat 'edgecolour description here.
%% a "star" shape, so that we can really see what's going on
%% with the edge colours!!
pp = [0,0,0; 1,-1,0; 1,1,0; -1,1,0; -1,-1,0];
ee = [1,2; 1,3; 1,4; 1,5];

%% important - only 1 colour known per edge, not per vertex!!
cc = (1:size(ee,1))';

%% setup a new set of vertices/edges/colours with duplicate vertices
%% so that each edge gets it's correct colour
nnum = 0;
pnew = zeros(2 * size(ee, 1), 3); %% new vertices
enew = zeros(1 * size(ee, 1), 2); %% new edge indices
cnew = zeros(2 * size(ee, 1), 1); %% new edge colours - via vertices
for j = 1 : size(ee, 1)
    n1 = ee(j, 1); %% old edge indices
    n2 = ee(j, 2);
    enew(j, 1) = nnum + 1; %% new edge indicies into pnew
    enew(j, 2) = nnum + 2;
    pnew(nnum + 1, :) = pp(n1, :); %% create duplicate vertices
    pnew(nnum + 2, :) = pp(n2, :);
    cnew(nnum + 1) = cc(j); %% map single edge colour onto both vertices
    cnew(nnum + 2) = cc(j);
    nnum = nnum + 2;
end

%% Draw the set efficiently via patch
tic
figure;
hold on;
patch('faces', enew, 'vertices', pnew, 'facevertexcdata', cnew, ...
    'edgecolor', 'flat', 'facecolor', 'none');
plot(pnew(:,1), pnew(:,2), 'b.');
axis equal;
toc
It would be nicer if MATLAB allowed you to directly specify the edge colour data - but it doesn't seem to support that...
Hope this helps.

