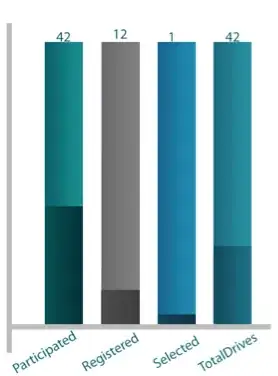
I have a dataframe that I groupby() count and then sort_values() by count. I then take the head() and tail() of this dataframe to plot on a seaborn barplot(). However, when I try to plot the head it shows the whole original dataframe instead of only the head() products.
most_popular_products= (items
 .groupby("product_name")
 .product_name.agg(["count"])
 .reset_index()
 .sort_values(by="count", ascending=False, ignore_index=True)
)
top_5_products = most_popular_products.head()
bottom_5_products = most_popular_products.tail()
Then I plot:
plt.figure(figsize=(20,6))

sns.barplot(x=top_5_products["product_name"], y=top_5_products["count"])
How I can only plot the top 5?
