I tried applying this solution to my case:
Emailing SPARKLINE charts sends blank cells instead of data
But when I try to apply it to my situation an error pops up with:
TypeError: Cannot read property '0' of null
On the executions there is more information about this error:
My GAS code for my Email solution is able to send just the values, and it's here:
function alertDailyInfo() {

    let emailAddress = SpreadsheetApp.getActiveSpreadsheet().getSheetByName("SANDBOX").getRange("F1").getValue();

    let treeIconUrl = "https://d1nhio0ox7pgb.cloudfront.net/_img/g_collection_png/standard/256x256/tree.png";
    let treeIconBlob = UrlFetchApp
                       .fetch(treeIconUrl)
                       .getBlob()
                       .setName("treeIconBlob");

    let treeUpdate = SpreadsheetApp.getActiveSpreadsheet().getSheetByName("SANDBOX").getRange("F6").getValue();
    let waterUpdate = SpreadsheetApp.getActiveSpreadsheet().getSheetByName("SANDBOX").getRange("F11").getValue();

            if (treeUpdate > 0) {

                    MailApp.sendEmail({
                        to: emailAddress,
                        subject: "TREE WATER UPDATE",
                        htmlBody: "<img src='cid:treeIcon'><br>" + '<br>' + '<br>' +
                        '<b><u>Tree average is:</u></b>'+ '<br>' + treeUpdate + '<br>' + '<br>' +
                        '<b><u>Water average is:</u></b>'+ '<br>' + waterUpdate + '<br>' + '<br>'
                        ,
                        inlineImages:
                        {
                            treeIcon: treeIconBlob,
                        }
                    });
                }
            }
The code from the solution presented on the link above and which I have tried to adapt to my situation (please check my file below) is here:
drawTable();

function drawTable() {

 let emailAddress1 = SpreadsheetApp.getActiveSpreadsheet().getSheetByName("SANDBOX").getRange("F1").getValue();

    var ss_data = getData();
    var data = ss_data[0];
    var background = ss_data[1];
    var fontColor = ss_data[2];
    var fontStyles = ss_data[3];
    var fontWeight = ss_data[4];
    var fontSize = ss_data[5];
    var html = "<table border='1'>";
    var images = {}; // Added
    for (var i = 0; i < data.length; i++) {
        html += "<tr>"
        for (var j = 0; j < data[i].length; j++) {
            if (typeof data[i][j] == "object") { // Added
                html += "<td style='height:20px;background:" + background[i][j] + ";color:" + fontColor[i][j] + ";font-style:" + fontStyles[i][j] + ";font-weight:" + fontWeight[i][j] + ";font-size:" + (fontSize[i][j] + 6) + "px;'><img src='cid:img" + i + "'></td>"; // Added
                images["img" + i] = data[i][j]; // Added
            } else {
                html += "<td style='height:20px;background:" + background[i][j] + ";color:" + fontColor[i][j] + ";font-style:" + fontStyles[i][j] + ";font-weight:" + fontWeight[i][j] + ";font-size:" + (fontSize[i][j] + 6) + "px;'>" + data[i][j] + "</td>";
            }
        }
        html += "</tr>";
    }
    html + "</table>"
    MailApp.sendEmail({
        to: emailAddress1,
        subject: "Spreadsheet Data",
        htmlBody: html,
        inlineImages: images // Added
    })
}

function getData(){
  var sheet = SpreadsheetApp.getActiveSpreadsheet().getSheetByName("SANDBOX");
  var ss = sheet.getDataRange();
  var val = ss.getDisplayValues();
  var background = ss.getBackgrounds();
  var fontColor = ss.getFontColors();
  var fontStyles = ss.getFontStyles();
  var fontWeight = ss.getFontWeights();
  var fontSize = ss.getFontSizes();
  var formulas = ss.getFormulas(); // Added
  val = val.map(function(e, i){return e.map(function(f, j){return f ? f : getSPARKLINE(sheet, formulas[i][j])})}); // Added
  return [val,background,fontColor,fontStyles,fontWeight,fontSize];
}

// Added
function getSPARKLINE(sheet, formula) {
  formula = formula.toUpperCase();
  if (~formula.indexOf("SPARKLINE")) {
    var chart = sheet.newChart()
      .setChartType(Charts.ChartType.SPARKLINE)
      .addRange(sheet.getRange(formula.match(/\w+:\w+/)[0]))
      .setTransposeRowsAndColumns(true)
      .setOption("showAxisLines", false)
      .setOption("showValueLabels", false)
      .setOption("width", 200)
      .setOption("height", 100)
      .setPosition(1, 1, 0, 0)
      .build();
    sheet.insertChart(chart);
    var createdChart = sheet.getCharts()[0];
    var blob = createdChart.getAs('image/png');
    sheet.removeChart(createdChart);
    return blob;
  }
}
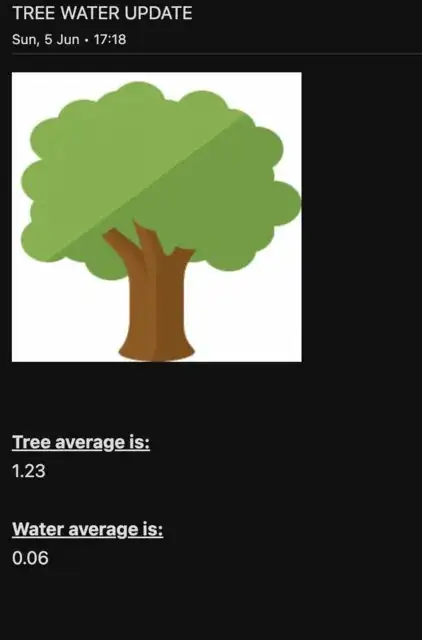
The code that is working just for the values, which I pasted above (1st block of code), will send me an email like this:
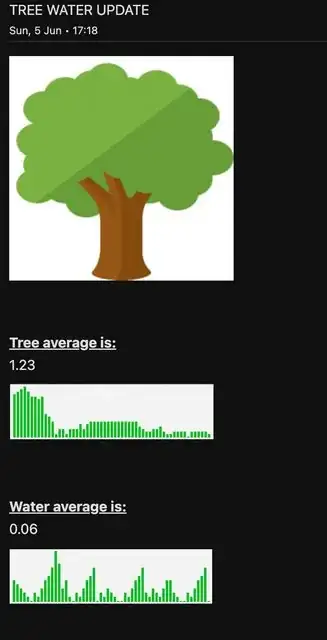
But I need to receive the email like this, with the Sparklines below the values like so:
The code for the Email solution, just for the values, I pasted above (1st block of code) is working. But for some reason when the code from the solution linked above (2nd block of code) is imported/saved into my Google Sheets file GAS script library and adapted to my case, everything stops working, displaying the errors mentioned above.
So basically, as you might have already understood, I need to send emails with the values from Tree Average and Water Average, and I managed to get that working. But I also need for the Sparkline graphs that you can see below, and by checking my file linked below too, to also be sent as images/blobs, just below the info, like in the screenshot above.
Can anyone provide any pointers on what can be missing in applying the solution above or is there a better alternative to sending a SPARKLINE graph as image/blob by email?
Here is my file:
https://docs.google.com/spreadsheets/d/1ExXtmQ8nyuV1o_UtabVJ-TifIbORItFMWjtN6ZlruWc/edit?usp=sharing
EDIT_1:
I made some edits to bring more clarity.
EDIT_2:
As requested this is the formula applied to the first Sparkline, the 2nd one is pretty much the same:
=ARRAYFORMULA( SPARKLINE(QUERY({IFERROR(DATEVALUE(SANDBOX!$A$2:$A)), SANDBOX!$B$2:$B},
 "select Col2
  where Col2 is not null
  and Col1 <= "&INT(MAX(SANDBOX!$A$2:$A))&"
  and Col1 >  "&INT(MAX(SANDBOX!$A$2:$A))-(
IFERROR(
          VLOOKUP(
           SUBSTITUTE($F$4," ",""),
            {"24HOURS",0;
            "2DAYS",1;
            "3DAYS",4;
            "7DAYS",8;
            "2WEEKS",16;
            "1MONTH",30;
            "3MONTHS",90;
            "6MONTHS",180;
            "1YEAR",365;
            "2YEARS",730;
            "3YEARS",1095},
           2,FALSE))
)-1, 0),
 {"charttype","column";"color","#00bb21";"empty","ignore";"nan","ignore"}))
EDIT_3:
At the advice of Rubén I have removed drawTable(); at the beggining of the code block.
I have also transfered the formula for the Sparkline to another helper sheet and link it to the main sheet.
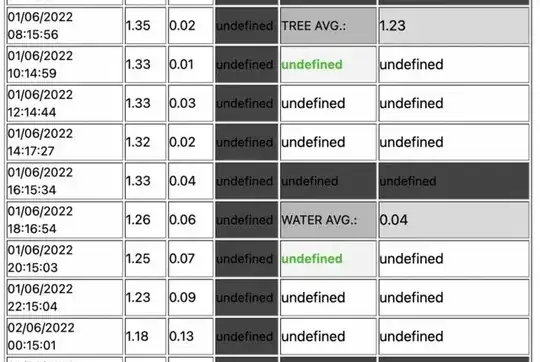
After trying it seems the error does not appear anymore. Although the email received has 2 problems:
- I receive the whole sheet in table form, where I just wanted the Sparklines.
- Also the Sparklines do not come as images, they do not show up at all. Also where they should appear it says
undefined.
I guess the whole sheet is being set because the function getting the range getDataRange(); is getting the whole sheet range.
Here is a screenshot:

