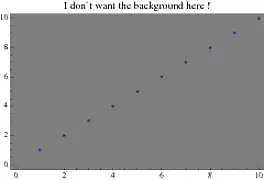
0

Considering:

ListPlot[Range[10], 
         Background -> Gray, 
         PlotLabel -> "I don`t want the background here !"]

enter image description here

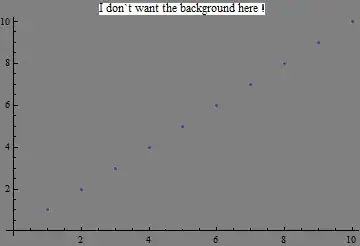
Is there any way to have the background applied solely to the actual plotting zone?

Not on the axis, not behind the label. So basically to the rectangle {{0,0},{10,10}} in that case?

EDIT: Can we do the Same using PolarListPlot?

Using Sjoerd Solution on From Cartesian Plot to Polar Histogram using Mathematica:

dalist = {{21, 22}, {26, 13}, {32, 17}, {31, 11}, {30, 9}, 
          {25,12}, {12, 16}, {18, 20}, {13, 23}, {19, 21}, 
          {14, 16}, {14,22}, {18, 22}, {10, 22}, {17, 23}}

ScreenCenter = {20, 15}

ListPolarPlot[{ArcTan[##],EuclideanDistance[##]} & @@@ (# - ScreenCenter & /@ dalist), 
               PolarAxes -> True, PolarGridLines -> Automatic, Joined -> False, 
               PolarTicks -> {"Degrees", Automatic}, 
               BaseStyle -> {FontFamily -> "Arial", FontWeight -> Bold, 
               FontSize -> 12}, PlotStyle -> {Red, PointSize -> 0.02}]

enter image description here

Cœur
  • 37,241
  • 25
  • 195
  • 267
500
  • 6,509
  • 8
  • 46
  • 80

4 Answers4

10

You could do something like this:

ListPlot[Range[10], PlotLabel -> "I don`t want the background here !",
  Frame -> {True, True, False, False}, AxesOrigin -> {0, 0}, 
 Prolog -> {Gray, Rectangle[Scaled[{0, 0}], Scaled[{1, 1}]]}]

enter image description here

abcd
  • 41,765
  • 7
  • 81
  • 98
  • Ah this is it ! And it works as such despite all my customized options ! Thank You ! – 500 Sep 04 '11 at 17:53
  • I had difficulty using this approach for grey backgrounds if the gridlines were white. I suspect `GridLines` is conceptually "behind" `Prolog`. – Verbeia Sep 05 '11 at 00:14
  • @Verbeia That is true. The documentation says: "Grid lines are always drawn below all the graphics". I guess a workaround would be to draw lines at the major ticks manually either as an `Epilog` or combine with `Show`. – abcd Sep 05 '11 at 02:55
  • 3
    @Verbeia Use undocumented option [`Method->{"GridLinesInFront"->True}`](http://groups.google.com/group/comp.soft-sys.math.mathematica/msg/11783ce8923d76b4). – Alexey Popkov Sep 05 '11 at 20:51
  • @Alexey Popkov - excellent idea, but don't they then go in front of the plotted lines as well? One of my recent questions relates to trying to replicate the institutional style of my current employer, but a few years ago I tried to do so for another organisation where I used to work, which also has a very particular style for its graphs. – Verbeia Sep 05 '11 at 21:42
  • @Verbeia Yes, the grid lines will go in front of the plotted lines. If you do not want it you could make background semi-transparent: `ListPlot[Range[10],PlotLabel->"I don't want the background here !",Frame->{True,True,False,False},AxesOrigin->{0,0},Prolog->{Gray,Opacity[0.5],Rectangle[Scaled[{0,0}],Scaled[{1,1}]]},GridLines->Automatic]`. – Alexey Popkov Sep 06 '11 at 04:51
  • @Alexey Popkov - try it with white gridlines. – Verbeia Sep 06 '11 at 07:06
  • @Verbeia For having white gridlines you probably have to define them via graphics primitives explicitly. – Alexey Popkov Sep 06 '11 at 10:16
  • 1
    @Verbeia Another possibility is to use `Inset` with automatically choosen `GridLines`: `Show[Graphics[{Gray,Rectangle[Scaled[{0,0}],Scaled[{1,1}]]}],Graphics[Inset[Graphics[{},PlotRange->{{0,10},{0,10}},GridLines->Automatic,GridLinesStyle->{{Thick,White},{Thick,White}},Method->{"GridLinesInFront"->True}],Center,Center,Scaled[{1,1}]]],ListLinePlot[Range[10],PlotStyle->{Thick,Red}]]`. – Alexey Popkov Sep 06 '11 at 10:24
5

You could use Labeled as in

Labeled[
  ListPlot[Range[10], Background -> Gray,
  PlotLabel -> "I don`t want the background here !"],
  "So place the label here", Top]
Mark McClure
  • 4,862
  • 21
  • 34
2
ListPlot[Range[10], 
         Background -> Gray, 
         PlotLabel -> Style["I don`t want the background here !",
                            Background -> White ]]

result

WReach
  • 18,098
  • 3
  • 49
  • 93
2

You could do:

Show[Graphics[{Pink, Rectangle[{0, 0}, {10, 10}]}], 
 ListPlot[Range[10]], Axes -> True, AspectRatio -> 1/2]

enter image description here

Edit

Perhaps better

c = RandomInteger[100, 10];
ListPlot[c,  Prolog -> {Pink, Rectangle[{0, Min@c}, {Length@c, Max@c}]}]
Dr. belisarius
  • 60,527
  • 15
  • 115
  • 190
  • Thank you, however now i lose all my plot options :-(. This is where I am trying to apply that. I don`t know if you can see the problem without the defintion of allRTbyConsistency and plotOptionsXX : Show[ Graphics[{LightGray, Rectangle[{0, 0}, {4.5, 1.6}]}], ListPlot[((Mean /@ (allRTbyConsistency[[All, #]] // Transpose)) & /@Range[3]), plotOptionsXX["Total RT by Consistency", "Response Time Total", "Consistency Index", Lighter[Red, #] & /@ {.1, .5, .9}], Joined -> True, PlotRange -> {{0.5, 4.5}, {0.5, 1.6}}, Background -> White, Frame -> True], Axes -> True, AspectRatio -> 3/4 ] – 500 Sep 04 '11 at 17:36
  • Better alternative: `Show[Graphics[{Pink,Rectangle[{0,0},Scaled@{1,1}]}],ListPlot[Range[10]],Axes->True,AspectRatio->1/2,PlotLabel->"I don't want the background here !"]`. – Alexey Popkov Sep 04 '11 at 17:41
  • Or using `Prolog`: `ListPlot[Range[10],Axes->True,AxesOrigin->{0,0},AspectRatio->1/2,PlotLabel->"I don't want the background here !",Prolog->{Pink,Rectangle[{0,0},Scaled@{1,1}]}]`. – Alexey Popkov Sep 04 '11 at 17:49