Similar questions have been asked here and here, however, none of the other answers solve my problem.
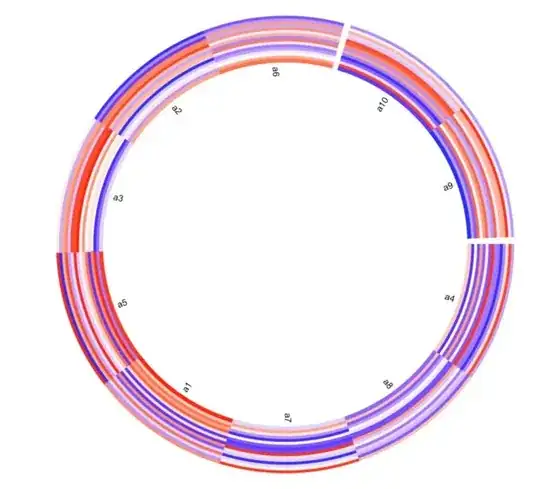
Im trying to join together two (or more) separate heat maps and turn them into a circle. Im trying to achieve something like the image below (which I made by following the circlize package tutorial found here:
In my data, I have multiple matrices, where each matrix represents a different year. I want to try and create a circular heat map (like the one in the image) where each section of the circular heatmap is a single year.
In my example below, I am just using 2 years (so 2 heat maps) but I cant seem to get it to work:
library(circlize)

# create matrix
mat1 <- matrix(runif(80), 10, 8)
mat2 <- matrix(runif(80), 10, 8)
rownames(mat1) <- rownames(mat2) <- paste0('a', 1:10)
colnames(mat1) <- colnames(mat2) <- paste0('b', 1:8)

# join together
matX <- cbind(mat1, mat2)

# set splits
split <- c(rep('a', 8), rep('b', 8))
split = factor(split, levels = unique(split))

# create circular heatmap
col_fun1 = colorRamp2(c(0, 0.5, 1), c("blue", "white", "red"))
circos.heatmap(matX, split = split, col = col_fun1,  rownames.side = "inside")
circos.clear()
The above code makes:
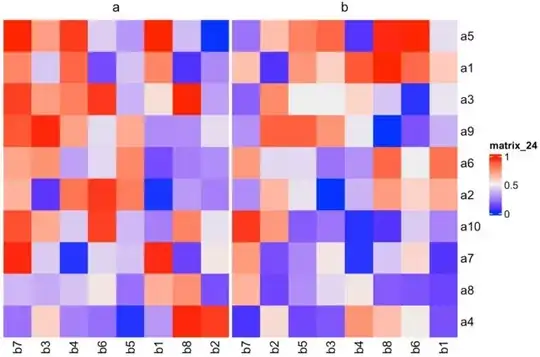
Im not sure where I am going wrong!? As when I use the ComplexHeatmap package, I am splitting the matrices correctly, as shown below:
#  using ComplexHeatmap package
library(ComplexHeatmap)
Heatmap(matX, column_split = split, show_row_dend = F, show_column_dend = F)
Any suggestions as to how I could achieve this?


