28

When trying to debug a ASP.NET MVC app, the breakpoints in my controllers arent getting hit. When entering debug mode they just show an empty red circle with a warning triangle instead of the normal full circle. This is strange because debugging was working fine until now, and no configuration changes have been made in my environment for a while.

I have seen this question and had a look at my modules view and the correct ones aren't being loaded, however I'm not sure how to remedy this. Also all the relevant pdb files are in the bin folder of the site.

Any suggestions on how to fix this?

Cheers!

EDIT: The app is running as a local site on IIS7 and I'm debugging with VS 2008
Community
  • 1
  • 1
Darko
  • 38,310
  • 15
  • 80
  • 107
  • Only happened to me when I modified code and put breakpoints without recompiling... Make sure you rebuild your solution. – Daniel Sloof Apr 09 '09 at 03:32
  • I have tried this already, thanks. – Darko Apr 09 '09 at 03:55
  • Or you are editing the wrong controller/view as I was. – TheTechGuy Feb 04 '14 at 18:12
  • Possible duplicate of [Visual Studio breakpoints not being hit](http://stackoverflow.com/questions/21582022/visual-studio-breakpoints-not-being-hit) – Michael Freidgeim Jan 13 '17 at 07:34
  • 1
    @MichaelFreidgeim this is not a duplicate. The problem is different and this question/answer predates the one you suggested by 5 years – Darko Jan 16 '17 at 04:31
  • @DarkoZ: Agree that details of the problems are different, but for readers it's good to view answers from both questions. "Possible duplicate" is a way to clean-up - to close similar questions and keep one with the best answers. The date is not essential. See http://meta.stackexchange.com/questions/147643/should-i-vote-to-close-a-duplicate-question-even-though-its-much-newer-and-ha If you agree that it requires clarification please vote on http://meta.stackexchange.com/questions/281980/add-clarification-link-to-possible-duplicate-automated-comment – Michael Freidgeim Jan 16 '17 at 07:18
  • @MichaelFreidgeim I see your point and generally agree, however in this case if we take votes as a guide, this question has both more votes, more answers, and more votes for the top answer and is therefore the more useful one of the two. I agree that there is also some useful info in the newer question as well, but if anything the newer question is the one that should be closed and the useful answers merged into this one. – Darko Jan 16 '17 at 22:16

20 Answers20

41

Ok so after 4 hours wasted, I find that setting my web project as the startup project solves the issue! This surely must be a bug...

I hope I save someone out there half a day :)

Darko
  • 38,310
  • 15
  • 80
  • 107
  • 6
    Same thing in VS2010, and the project WAS the start project, but it worked to change the start action from "Don't open a page. Wait for a request from an external application" to "Current Page". (Then, when I set it to the original setting, it still worked.) Something about this reset the symbols problem. Weird. – Joshua Frank Jul 30 '12 at 14:56
  • same thing is VS 2013. – CathalMF Mar 15 '16 at 15:35
  • 1
    I'm very happy you noted that changing the startup project changed the ways that breakpoints are regarded by the debugger. I'm also sorry to say it explains a great deal of the chaos I *commonly* experience in the most modern editions of Visual Studio when debugging MVC. – Hardryv Mar 03 '21 at 17:40
11

Few more possibilities:

  • If you have a client and server in your solution (lets say a WPF and WCF app) you should make sure you select 'multiple startup projects'. [this one is similar to your accepted answer, but useful if you need a client running too]

  • Release mode is selected for the project. When doing a fresh get (as I discovered today) on a new machine VS seems to like to switch to 'Release' configuration profile.

Simon_Weaver
  • 140,023
  • 84
  • 646
  • 689
5

Some team member deleted the Debug configuration for one project (The MVC Project). Though the Solution configuration was set to "Debug / AnyCPU", if you looked in the configuration for that, the Project-Configuration for the MVC Project was set to Release, with no option for Debug, and all other projects were set as Debug appropriately.

So I added Debug back to the project configurations (Just drop-down "Add"... uncheck the box to add to solution). And viola...

Suamere
  • 5,691
  • 2
  • 44
  • 58
5

I had the same problem. Check here: Tools->Options->Debugging

Fix by selecting Enable .Net Framework source stepping

Brian Ibbison
  • 51
  • 1
  • 1
  • I don't think so. That allows you to debug through framework code, so you'll see it loading up a whole loading of dlls as symbols. You should be using Just My Code. – Savage Apr 30 '20 at 11:21
3

None of these answers helped me. Some of my breakpoints were hit, and some not. But I discovered the problem in my case.

If there is a file at the exact same virtual location with the exact same name as the URL you are trying to debug, the file will be served to the browser automatically by IIS and the breakpoint will not be hit because no MVC code actually runs.

NightOwl888
  • 55,572
  • 24
  • 139
  • 212
3

Things to try:

  1. Clean the Solution, then rebuild it.

  2. If that doesn't work, close the solution, delete the bin and obj folders, and rebuild.

  3. If that doesn't work, restart the IDE after doing step #2.
  4. If you're debugging an ASP.NET project hosted by IIS, make sure you're attached to the correct process (w3wp.exe).
George Stocker
  • 57,289
  • 29
  • 176
  • 237
1

Change in Visual Studio Header Release option to Debug

Muhamed Shafeeq
  • 1,194
  • 1
  • 9
  • 15
1

Most of time when your solution has changed into debug to Release mode.

https://www.youtube.com/watch?v=Tc-EamOXAcQ

1

The following has worked for me most of the time when I had this problem:

Find where your projects dll cache is being held (usually in ASP.NET Temprorary Files). Then close VS, do an IISRESET /stop (if you're using IIS), delete all the files in dll cache. Do an IISRESET, start VS, open your project and rebuild it.

SirDemon
  • 1,758
  • 15
  • 24
  • I gave it a try but the same problem persists, no modules for my web project in the modules view. – Darko Apr 09 '09 at 03:54
0

I had the same problem. Check here: Tools->Options->Debugging

Check the script check box. Run the application.

I got installation corrupt message box, so did a repair of vs 2008, and its working now.

JS.
  • 145
  • 1
  • 2
  • 9
0

Clean / rebuild didn't work for me. Restarting VS did.

VS 2012, ASP.NET MVC 3, IIS Express.

Rik Hemsley
  • 877
  • 1
  • 10
  • 15
0

I had this problem today - then found out that it happened because:

  1. Visual Studio 2008 had crashed, leaving Cassini (the intrinsic development web server) running on the original port.

  2. When I reopened my project and "Started" it, it couldnt run on the original port because the old development web server was still running (which I didnt notice)

  3. The pages browsed fine, but no breakpoints got hit because the URL I was using was still pointing to the old development web server port.

Jimbo
  • 22,379
  • 42
  • 117
  • 159
0

Make sure that your compilation framework version is the same as your project's compilation framework.. I ran into this and it was because the project was being compiled as 4.5 and the compilation attrib in the web config was trying to debug it as 4.5.1.

Dan
  • 1
0

It might be helpful to:

  1. Close Visual Studio
  2. Stop application pool in IIS Manager
  3. Delete bin and obj folder
  4. Start appliction pool
  5. Open Visual Studio and rebuild solution
Fka
  • 6,044
  • 5
  • 42
  • 60
0

I had a similar problem with a simple Web API project in Visual Studio 2015. I solved the problem, after reading that the easy fix was to set the Startup Project to the correct project. Since I had another Web API project in the same solution, I guessed that the project I was debugging was mixing up which index.html to debug, so I renamed that current one to index2.html. Then setting the Project properties Web tab to Specific Page and the page text: "index2.html" solved the problem.

0

My solution was basically my mistake because I had moved the project folder. My resolution was, after I moved the folder, do NOT use "Open...Open website" and then browse to your website folder. DO NOT browse to your solution .sln file and open with that. Instead, DO USE "Open...Project/Solution" then browse to your csproj file and open that. Close IIS(Express) first. Rebuild. It should run the latest copy. The .sln will mess you up every time.

tripleee
  • 175,061
  • 34
  • 275
  • 318
MartyP
  • 1
  • 1
0

I had Shelved my changes in TFS and had a breakpoint set on a shelved cs file that was not part of the solution anymore. Once I retrieved my Shelveset, everything worked.

JohnWrensby
  • 2,652
  • 1
  • 18
  • 18
0

Quick fix...

Run my project in Debug. Cleaned and rebuild solution (MVC).

Re run the UI project and the Breakpoints started working again.

Hope this will help someone.

Tom
  • 343
  • 2
  • 7
0

I have read and implemented all the suggestions above, to no avail.

What worked for me is, i simply changed the controller action i was trying to break into to [HttpPost].

My issue was that i was trying to debug a method decorated with a [HttpGet] attribute routing to a different view and instead of hitting my break point, it keeps routing and displaying the return view.

Hope this helps someone!

Happy coding.

Chidi-Nwaneto
  • 634
  • 7
  • 11
0

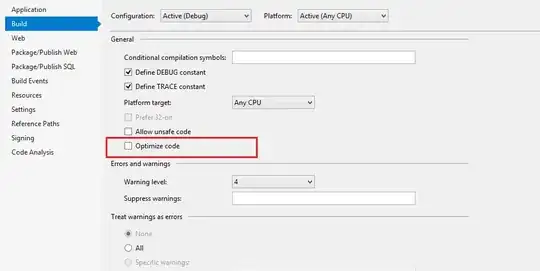
I found that the Optimize code checkbox on the project properties window, Build tab, would also cause this to occur.

Uncheck this checkbox as well.

Optimize code checkbox on Build tab of Project properties

GER
  • 1,870
  • 3
  • 23
  • 30