This is a bit over the top, but I couldn't find an R or native Leaflet method of adding events, so I improvised. This will require htmlwidgets. I didn't call the library; I just appended it to the function.
For this to work correctly, the countys' paths need to be ordered when rendering. The easiest way to make this happen is to order the data by county. I did this in the trace, not in the data itself.
I also changed the weight from 1 to 2; otherwise, you could barely see the outline.
In the Javascript, I added a lot of comments. If there is anything that's still unclear, let me know.
I only made it so that the outline would show when you searched for the county. If there is something else you want, let me know!
leaflet(data = nc) %>% addPolygons(stroke = FALSE, fill = F) %>%
  addTiles(group = "OSM")%>%
  addProviderTiles(provider = providers$OpenStreetMap) %>%
  addPolygons(data = nc %>% arrange(NAME),  # <--------- I'm new!! order the paths!
              weight=2, popup = ~NAME, fill = F,
              label = ~NAME, group = "name", col = 'transparent') %>%
  addSearchFeatures(targetGroups  = 'name',
                    options = searchFeaturesOptions(zoom=10,
                                                    openPopup=TRUE)) %>%
  htmlwidgets::onRender(
    "function(el, x){
      traces = x.calls[3].args[4]; /* this is an object with the county names */
      function outliner(tellMe) {  /* function called when popups change */
        paths = document.querySelectorAll('svg > g > path'); /* find all paths */
        arr = [];       /* store indices that are transparent (where the counties are) */
        for(j = 0; j < paths.length; j++) {
          showMe = paths[j].getAttribute('stroke');
          if(showMe == 'transparent') {
            arr.push(j); /* indices of which paths are relevant */
          }
        }
        chng = [];       /* capture indices to connect counties to their paths */
        if(tellMe) {                              /* if tellMe exists, not false */
          init = traces.indexOf(tellMe);          /* initial, is there more than one path? */
          finit = traces.lastIndexOf(tellMe);
          if(init !== finit) {                    /* there is more than one path! */
            for(k = init; k <= finit; k++) {
              chng.push(k + arr[0]);     /* index plus offset to get the right path */
            }
          } else { chng = init + arr[0]}          /* index plus offset to get the right path */
        }
        if(chng == -1) {tellMe == false}          /* if nonsense captured, don't change the map */
        for(i = arr[0]; i < arr[arr.length - 1]; i++) {     /* look at every path, remove or add outline */
          if(tellMe) {                            /* does it exist and not false */
            if(typeof(chng) == 'number'){         /* county represented by a single path */
              if(i === chng){
                pathic(i)                         /* if popup outline */
              } else {
                unpath(i)                         /* no outline */
              }
            } else if(typeof(chng) == 'object') { /* more than one path for county */
              if(chng.indexOf(i) !== -1) {
                pathic(i)                         /* if popup outline */
              } else {
                unpath(i)                         /* no outline */
              }
            }
          } else {unpath(i)}                      /* no outline */
         }                                        /* end for */
        }                                         /* end outliner */
        function pathic(ind) {                    /* I outline things */
          paths[ind].setAttribute('stroke', 'blue');
        }
        function unpath(ind) {                    /* I remove outlines */
          paths[ind].setAttribute('stroke', 'transparent');
        }
        $('div.leaflet-pane.leaflet-popup-pane').bind(\"DOMSubtreeModified\", function() {
          if(this.innerHTML) {    /* add the event to the DOM */
            which = $('div.leaflet-popup-content').text();
            outliner(which);                      /* if popup, what does it say? */
          } else {
            outliner(false)                       /* no popup! */
          }
      })}")
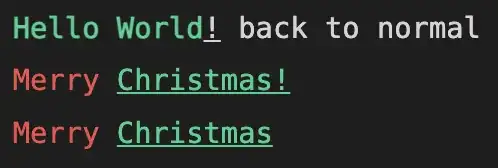
You can see here that it removes the previously searched county's outline.
