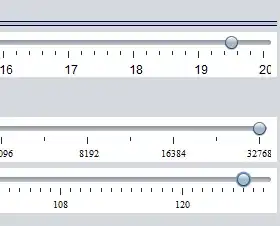
I'd like to plot a graph like this tweet:

Does anyone know how to create a graph like this in matplotlib/seaborn?
I tried making a similar graph using matplotlib, but am having difficulties.
I'd like to plot a graph like this tweet:

Does anyone know how to create a graph like this in matplotlib/seaborn?
I tried making a similar graph using matplotlib, but am having difficulties.