0

I have a dataset like this (don't look at column 4,5 and 8) enter image description here
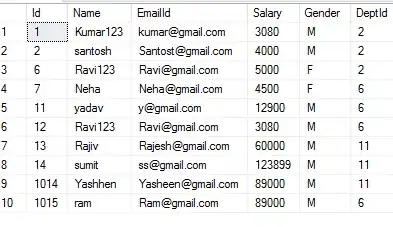
These are temperature and humidity measurements at different days of the year (january to august), taken by different sensors (8 in total) at different timestamps of the same room. The final df has more than 100.000 rows. I wanted to study temperature and humidity trends for those months, trying to detect anomalies within the same sensor (maybe one of them has outlier records) and between ALL sensors (I would like to detect sensors which had wrong temperature and/or humidity entries compared to others). What would you do? Which algorithms would you use? Any suggestion would be like gold to me

  • To start, you could group by sensor and day and extract min and max to shrink your data by 96% (at hourly values): extreme values per sensor and day should already give an overview over suspicious sensors. Compare with boxplots and/or pairplots, find outliers e.g. with package {outliers}. – I_O Dec 09 '22 at 15:20
  • @I_O already did that, but `tsoutliers` gives me results that do not seem to make sense – Bartholomew Dec 09 '22 at 15:29
  • If you already did that, you should edit your post and add the suggestions from this: https://stackoverflow.com/questions/5963269/how-to-make-a-great-r-reproducible-example ... such as don't add images of data, provide data, even if it's made up as long as it's similar to yours. And include the code you've used. – John Polo Dec 09 '22 at 15:54
  • If you need help creating a statistical model for your data, you should ask for help at [stats.se] instead. You are likely to get better help there. This is not really a specific programming question that's appropriate for Stack Overflow. – MrFlick Dec 09 '22 at 16:19

0 Answers0